Thursday, April 2, 2015

Graduation Improvement (Estimating Our Ten-Year Progress)


Updating three posts from PrichBlog's early days (here, here and here), the chart above compares numbers of students tested at the end of grade 8 and numbers who made it to graduation four years later.

My previous post on this puzzle reported 2010 data, and since then, our graduation count is up 11 students, and the missing eighth grade count is down by 1,120.

Since 2005, the results are even more impressive, with graduates up by 5,598, and missing eighth-graders down by 4,757. 

Naturally, it would be better to be able to compare graduates to exact numbers of fall first-time ninth-graders. Before Kentucky was able to track individual students over time, the testing counts offered the closest I could come to a no-duplication estimate of the students who would make up that ninth-grade class.  Starting in 2009, we've been able to track each freshman through the high school years, which is why 2013 was the first year we could report a four-year cohort rate.  The estimation approach shown above has a trade off: a longer look using numbers that are a less exact match to what we really want to know.  When we have 10 years of cohort rates, it will be great not to need this kind of technique.

Still, this method gives us a sense of our progress over a sweep of years, and it's good to see Kentucky gaining on this challenge.

(Source notes: Eighth grade testing counts come from Kentucky Department of Education assessment results files for 2001 through 2010. 2005 through 2010 graduation counts are from KDE "Nonacademic Data" briefing packets.  2011 graduate counts from KDE's Average Freshman Graduation Rate reporting, while  2012 through 2014 graduations are from the school report cards.)

--Posted by Susan Perkins Weston

Wednesday, April 1, 2015

Arts Education for the 21st Century: A Bold Proposal

A January 2015 "vision paper" from Kentucky's arts education organizations argues for major new steps to "ensure that all students have access to a high quality arts education; one that truly supports developing students’ artistic talents and abilities as mandated by Senate Bill 1."

In addition to supporting adoption of the National Core Arts Standards, the paper provides detailed recommendations around three major goals:
  • Protect time for discipline-specific, standards-based arts instruction
  • Provide for high quality specialized arts teachers to deliver visual and performing arts instruction 
  • Ensure that statutory, regulatory, and KDE terminology supports high-quality arts education 
The paper provides concrete evidence that arts teaching and learning have been eroded significantly in recent years, and offers this blunt statement about our current accountability approach:
"Improving arts education in Kentucky will call for more than Program Reviews, because the reviews currently lack rigor due to of a lack of statutory and regulatory support, have limited, questionable reliability because they are self-reported, utilize a rubric that is subject to wide interpretation in the hands of non-arts specialists, and lack an auditing process to encourage and ensure honest appraisal."
The Kentucky Coalition for Arts Education issued the paper and a briefer brochure on the same ideas.  The Coalition includes the Kentucky Art Education Association, the Kentucky Association of Health, Physical Education, Recreation and Dance, the Kentucky Music Educators Association, and the Kentucky Theatre Association.  I'm looking forward to seeing this discussion develop!

--Posted by Susan Perkins Weston

Tuesday, March 31, 2015

Only 699 were ready


Our statewide school report card shows that in 2014, only 699 students with disabilities graduated ready for college or career, while 2,393 graduated without being ready for successful futures. 

Quite a few more did not graduate: the school report card shows a four-year cohort graduation rate of 70.8% for students with disabilities, and I did a quick backward calculation to form the estimate of 1,275 non-graduates shown above.

There are some other ways to state this problem.  We can say that 23% of graduates with disabilities were college or career ready, compared to 65% of graduates without such disabilities.  Or we can say that about 16% of students with disabilities who started high school in 2010 graduated college and career ready four years later, compared to 58% of their classmates without disabilities.

Still, it's the simplest number that seems most haunting: only 699 were ready.

 --Posted by Susan Perkins Weston


Monday, March 30, 2015

Higher Education Looking Stronger (Much Stronger)

The chart above made my jaw drop.

For years, I've been blogging the reported graduation rates for Kentucky higher education for years.   I've cited figures like a 52% six-year graduation for full-time, first time students who entered Murray State in 2005, and a 37% six-year rate for full-time, first-time students who entered Northern Kentucky University that year.  For associates degrees statewide, I've displayed a 32% three-year graduation rate for students who started full-time study in 2006, and reported that as better than most states' results for that time frame.

Just eyeballing the graph above, you can tell it suggests something much better.  Doing the arithmetic, we had 2009 graduates equal to 85% of our 2005 freshmen, and 2014 graduates equal to 88% of our 2010 freshmen.

How can the results be so different?  The big reason is probably that the reported graduation rates for each school count only the ones who start and finish at the same institution, while this method looks at the whole system, so that transferring and graduating counts as much as staying put and graduating.  Even knowing that transfers weren't accounted for, I never imagined that the impact could be on this scale.

The starting and entering numbers shown above also aren't perfect matches.  Here are some of the limits on the comparisons shown above:
  • Many of the 2014 bachelors degrees probably to students who started before 2010, and a bunch of the 2014 associates were earned by students who started in 2011 or 2012--but over the long run, that's more about timing than about whether students end up with a degree in hand.
  • Some students may earn very few credits their first year, and end up being counted as freshmen more than once--but that would make the number of students who start working toward a degree smaller, so that the number who earn degrees would be more impressive.
  • Some of the graduates may have transferred in from out-of-state. Depending on whether more students transfer in than transfer out, those transfers  could help or hurt the overall picture.
  • Some may have transferred from private institutions--and I do have anecdotal evidence that the flow of transfers does move toward the public sector and make the total graduations look stronger.
  • Some students who earn bachelors degrees earn associates degrees first, so they're counted in two different years--and each double degree means someone else who didn't finish at all.
  • Some students earn two degrees at the associates level or the bachelors level, and they'll also be counted more than once and offset some who don't make it to graduation at all.
Even with all of those factors, the chart above suggests that Kentucky's public institutions are graduating something like 80% of the students they enroll. That's good news that's very different than the graduation rates I've shared in past posts on higher education.

(Matt Reed's post on "Dropouts, Grads, and Terrible Counting" pushed me to do this comparison of the big numbers, and I'm grateful for the nudge.  The numbers in the chart come from the Council on Postsecondary Education's reporting on enrollment and degrees.)

--Posted by Susan Perkins Weston

Sunday, March 29, 2015

The Internet Can't Replace Great Teaching

"When kids can get their lessons from the Internet, what's left for classroom instructors to do?"  I read that provocative question at the start of a recent Atlantic piece on "The Deconstruction of the K-12 Teacher", and I was, in fact, provoked.

Michael Godsey, the California English teacher who wrote the piece,  is bedazzled by the potential of videotaped lectures and downloaded lesson plans, to the point that he doesn't see how future teaching will require much more than fairly limited (and perhaps quite poorly paid) facilitators and cheerleaders.

I'm provoked because I think he's missed the most exciting current thought about teaching and learning.  Everything I'm hearing in Kentucky education says that live adults, actively engaged with students as individuals and team participants, will always be essential to the kind of learning that matters most.

For example, I've been listening to teachers who are participating in the work of the Mathematics Design Collaborative and using the MDC tools known as "classroom challenges" or  "formative assessment lessons."  Each challenge starts with a rich math task and organizes a learning process that draws students into "a productive struggle with the mathematics essential for college readiness."  There are standard handouts and tools, and the lesson follows a carefully designed set of directions, and yes, all those items are downloaded from a website.  The main steps work like this:

1) Students are given an easily administered initial assessment task. This provides teachers with a qualitative sense of their students’ grasp of the targeted mathematics, and that evening, the teacher uses the student's first responses to decide which activities will be most appropriate for the net day's work.
2) Students are immersed in the mathematics of the initial assessment task through a set of collaborative activities. This part is designed as a guided inquiry. Students work in small groups, engage in discussion, take responsibility for their own learning, and learn from each other, often by examining one another’s work. Teachers circulate as the students work, asking questions or offering small suggestions when needed, deciding minute by minute which help can best move their students’ learning forward.
3) Students are engaged in a whole-class discussion. This is designed to pull the lesson together. Students get to strengthen their understanding while teachers get to deepen their insights into their students’ learning. It provides another opportunity to structure discussion, provide feedback, and allow students to learn from each other.
4) Students return to improve their response to the initial assessment. This gives students a look at what they’ve learned as well as more feedback, while providing teachers perspective on the effectiveness of their teaching.
Here's the important point for thinking about the Atlantic column: teachers say they're working at the top levels of their content knowledge and capacity for rapid decision-making all the way through the process.  For this kind of teaching, deep content knowledge is essential, and deep engagement with each student is essential, and the two have to be combined with great flexibility right in the moment.

Now, to be sure, if we only needed students to do accurate addition, computers probably can drill kids often enough and precisely enough to get us that limited (though important) skill. But we don't just need that.  We need students who can grab a mathematics challenge, try an approach, think through its effectiveness, talk with colleagues, revise their approach, and struggle productively to an answer that works well.  And we need students who will do that, because they have learned that they can in a setting with meaningful support and meaningful challenges.

To learn all of that, students need teachers who know them, engage them, work with them, share deep expertise in the content and practices of their academic field, and help students move one by one and step by step to becoming expert practitioners in their own right.  It's personal, humane work, and it will always be done best by personal human contact.

Saturday, March 28, 2015

Kentucky Funding More Equitable Than Most (EdTrust Report)


Here's an occasion for Kentucky pride: our school districts that serve the most students living in poverty receive more funding.  The Education Trust's new Funding Gaps report compares 2012 funding for each state's districts with the highest and lowest proportions of poor students and finds that:
  • 11% more funding flowed to Kentucky's districts with the most poor students, as compared to the districts with the fewest poorest kids. 
  • Only six states had a stronger record of added support for districts with the most concentrated poverty: Ohio, Minnesota, South Dakota, Delaware, Tennessee, and Indiana.
  • Kentucky's added funding was enough to cover an estimated 40% additional cost to serve students in poverty, compared to what it takes to serve students from financially better-off backgrounds.
One caution: this study is good confirmation that we're sharing our "funding pie" relatively fairly, but it doesn't tell us whether "the pie" as a whole is big enough to meet our children's needs and equip them for adult success.  EdTrust compared Kentucky districts to other Kentucky districts, but not to the funding across the country or an estimate of adequate funding.

Still, this report is a plus for Kentucky.  We're investing in all our children on a relatively equitable basis, and that's a great good thing about our state.

The Funding Gaps report comes with plenty of additional detail, including interactive maps, reports on all states, and details on funding for districts with the most children of color (Kentucky looks good there, too).  Do check it out, and do let us know what you see as important or curious in the results.

--Posted by Susan Perkins Weston

Friday, March 27, 2015

2015 Early Childhood Profile

The annual Early Childhood Profiles provide a wealth of information about enrollment in state preschool and Head Start programs, child care quality and availability, kindergarten readiness, and other issues, and the 2015 editions for each county in the state are new this week from the Kentucky Center for Education and Workforce Statistics.

There's so much to see here, so I'll share just one thing I looked at.  I tried looking at the number of three-and-four-year-olds participating in state preschool and the federal Head Start program, and figuring out how many other kids were in that age group.  Statewide, that gave me a picture like this:


The number shown for "At Home or In Private Settings" is just the result of subtracting the other numbers from the 110,238 reported children ages three and four statewide.

It was uncomfortable to see so many children not in either program, so I also tried estimating what's happening just with the children who are now four.  We only offer preschool and Head Start based on low family income to the fours, so I think this is a probably a good illustration of what's happening for that older half of the group:

This second picture suggests that most, but not all kids have some school-type experience before they start kindergarten.  It makes me curious about how many Kentucky kids attend private preschools, and also about ho2 child care experience compares as a preparation for beginning school: my starting guess is that the kids would be used to being with a non-parent and used to some group activities, but maybe not as familiar with learning-oriented activities and paying attention, and I'd love to learn from the folks who actually work with the kids as they begin their kindergarten year.

Take a look and see what you see in the state or your own county's Early Childhood Profile. Is there something you're pleased to see? Concerned to see? Curious to learn more about?  Please do share in the comments if something catches your eye.

-Posted by Susan Perkins Weston

Thursday, February 5, 2015

Senate Bill 8: Another Approach To Charters

Senate Bill 8 is the second charter bill proposal in the 2015 session. It proposes a pilot charter program in Kentucky's two largest districts, with enrollment limited to students from low-income families who attend schools with unusually weak performance.

We've taken the eight questions from Exploring Charter Schools in Kentucky: An Informational Guide, and developed "Answers for Senate Bill 8" to summarize key features of the new bill.  The new summary available in a public DropBox folder, along with the earlier summary of House Bill 174.

Check it out, and do share questions if you have them!

--Posted by Susan Perkins Weston

Thursday, January 22, 2015

House Bill 174: One Approach To Charters

In November, the Prichard Committee released Exploring Charter Schools in Kentucky: An Informational Guide, a report designed to "be useful to Kentuckians with many different views" on the charter issue, "clarifying possibilities and challenges and informing a broader public discussion about how best to equip Kentucky students for successful futures."

The body of the report was organized around "Eight Questions for Any Charter School Bill."

With the opening of the 2015 General Assembly, House Bill 174 is the first that can be analyzed using those questions.

In "Answers For House Bill 174," you can find two pages that do just that.

It's available in a public DropBox folder, and if other bills are filed on this issue, the plan is to share similar summaries in the same folder.

Check it out, and do share questions if you have them!

--Posted by Susan Perkins Weston

Saturday, January 10, 2015

2015 Quality Counts: Results for Kentucky

The 2015 Quality Counts report is out from EdWeek, using a new approach to grading Kentucky, the 49 other states, and the District of Columbia.

In three categories, we can still compare grades from 2013.  Quality Counts now grades Kentucky:
  • C on Chance of Success, the same as 2013, while moving up from 38th to 35th.
  • C on Equity and Spending, up from a C- in 2013, while moving up from 34th to 26th.
  • C- on K-12 Achievement, the same as 2013, while moving down from 13th to 19th.
On one new category, Quality Counts grades us:
  • C- on Early Childhood, with a rank of 26th. 
Quality Counts no longer gives grades on three kinds of state policy choices:
  • Transitions and Alignment, on which Kentucky had a 2013 grade of A and ranked 4th.
  • Standards, Assessments, and Accountability, where we had an A- and ranked 20th.
  • Teaching Profession, where we had a B- and ranked 5th. 
Combining all those changes, Quality Counts now grades our state:
  • C as an overall grade, down from a B-, with our rank dropping from 10th to 29th.
So, we do have a drop in grade and rank, driven by the elimination of policy commitments as a source of grades.  Those grades were about our state-level willingness to commit to big changes, but not about whether those commitments were altering what really happens for students. EdWeek used to give us credit for effort, and it seems pretty reasonable that they're now looking at what our efforts produce.

Opinion: Quality Counts 2015 ends up saying that Kentucky education is producing:
  • Stronger results (19th in K-12 Achievement)
  • With ordinary resources (26th in Early Childhood and in Equity and Spending)
  • For students who face deeper challenges than those in most other states (35th in Chance for Success)
On balance, I think we should all pause and be pleased with these results for a full 90 seconds before we get back to work on moving our kids to the higher levels we know they can attain.

Tuesday, December 9, 2014

What the Research Tells Us about Charter Schools & How That Informs Our Next Steps [With Correction]

In October, the Prichard Committee convened a core group of its members and constituents to study the research and findings of our nation’s now 20 year experiment with public charter schools. The issue of charter schools has been debated for several years in Kentucky with the discussion often reflecting the strongly held positions of supporters and opponents. Forty-eight Forty-two states in the nation have charter enabling legislation, beginning with Minnesota in 1991. Kentucky chose a different path to local autonomy, innovation and reform with the passage of the Kentucky Education Reform Act of 1990; which included school-based decision making (SBDM) councils meant to ensure the community has a strong hand in local decisions regarding community schools. More recently, the passage of Districts of Innovation allows districts to request waivers from specific regulations to allow for creative ways in achieving student outcomes.

Honoring Kentucky’s tradition of reform and commitment to student achievement, the Committee sought first to better understand the opposing viewpoints and to identify a common definition of charter schools. The viewpoints ranged from a deeply held belief that the public education system should allow for more choice by parents to an equally strong belief that public investment should be used to strengthen the traditional system of education in an effort to serve students better. The common thread definition for all charters is that they accept responsibility for student outcomes in exchange for freedom to innovate and public funding. 

We worked through the fall to gather unbiased information on the organizational and operational elements of charter schools. We took a close look at charters in Louisiana, and New Orleans specifically where public charters were used to quickly get a system of education back up and running in the aftermath of hurricane Katrina. We engaged the National Council of State Legislatures to provide a landscape of charters across the country and to help us understand the funding mechanism for public charters; the National Governor’s Association to help us understand the intricacies of legislation and regulation to ensure strong charters should Kentucky choose to go in that direction; we heard from Kentucky's Commissioner of Education, Terry Holliday who experienced charters first hand as a superintendent in North Carolina and has expressed nuanced support; and we relied heavily on the research from CREDO, the Center for Research on Educational Outcomes at Stanford University, that produced the first comprehensive study of charter school impacts on student performance in 2009 and followed with a second study in 2013. 

What the Committee found, in a nutshell, is that the overall performance of charters has been mixed. There are clear success stories through major charter management organizations with a longstanding track record of success, like KIPP, but the research does not currently support generic start-up charters as a clear path to higher student achievement. While the CREDO report finds that charters can be beneficial in urban settings and with African American students living in poverty, the same does not hold true for rural and suburban students. Furthermore, the need for both strong parent engagement and collaboration between all public schools within a district (including charters) were both cited in our discussions as critical indicators of overall success regardless of public charter or traditional public school. 

 Source: CREDO 

The Committee plans to continue to study the issue with an emphasis on finding effective ways to close achievement gaps that continue to persist between groups of students. Our hope is to come up with a portfolio of tools to use in addressing Kentucky’s persistent achievement gaps. 

At this point, the Committee decided to release detailed information to the public in a report entitled, “Exploring Charter Schools in Kentucky: An Informational Guide” We hope this information proves useful if policymakers continue to debate enabling legislation for charters in Kentucky. Kentucky is leading the way in many areas of education reform – and with a fair amount of success. The Prichard Committee has been committed to student progress by closing achievement gaps, ensuring strong accountability, and adequate funding for over 30 years now. It is through that same lens that the Committee now studies the issue of public charter schools.
--Stu Silberman

Correction note: This post has been revised to show the correct number of states that currently allow charter schools, with our thanks to the alert reader who identified the mistake.

Sunday, October 19, 2014

The Children We Leave Behind: Seeing and Engaging The Results


Which student subgroups have the worst achievement gaps, so severe that the group performs like the lowest 1% of all students?  In Kentucky, gaps that deep earn a "focus school" identification under Kentucky's accountability regulation. (Technically, the designation applies when a subgroup has "a score in the third standard deviation below the state average for all students," but that works out to something very like the bottom 1%.)

In this year's list of focus schools, students with disabilities are, by far, the group most likely to have results that earned that designation.   The pie chart above shows that for reading, and matching charts below show that that the pattern is similar for every other subject Kentucky tests.

I don't like what I see in these charts, but I do like being able to see it.  We should not hide from this kind of truth about how we are doing as a state. In each community where a student group is struggling this deeply, we should be talking about the problem and pulling together to solve it.

We should be pulling together to meet children's needs if the group being left so far behind is students with disabilities. We should engage just as intensely if the group is African-American students, Hispanic students, students with limited English proficiency, or students who qualify for free or reduced-price meals: those problems happen in fewer schools, but when they occur they are just as urgent.

Do the schools in your community have a student subgroup that is being left this far behind?  You can find the full list of Focus Schools by going to the Supplemental Data portion of KDE's Open House Portal, clicking the link for Accountability, and scrolling to the bottom of the page.  Please do check, and please do discuss what you find with your neighbors and your local school leaders.  We can change this picture, but only if we see it and engage it.


Thursday, October 16, 2014

Susan's Opinion: Social Studies without History is a Bad Idea

Proposed new  social studies standards are drawing teacher concerns, according to today's Herald-Leader report.  Teachers say the standards give little guidance on what students should learn each year.

The draft Kentucky Academic Standards for Social Studies is available in the materials for the October 7 Kentucky Board of Education meeting: go to that portal, scroll down to Item IX and then look for Attachment B.

I've read the full document, and I agree with the teachers. My biggest concern is that the draft social studies standards contain no history.

No Valley Forge, no Gettysburg, no D-Day, no Berlin Wall, no falling Twin Towers. No Industrial Revolution and no Depression. No slavery, no segregation, no civil rights movement. No Trail of Tears. No debate over the Bill of Rights and no seventy-year struggle for women's suffrage. And for that matter, no Isaac Shelby, no Isaac Murphy, and no Kentucky at all except for a single reference to the state constitution.

Instead, there's only a section on Historical Thinking, which calls only for overarching skills in thinking about history: chronological reasoning, contextualization and perspectives, historical arguments, and interpretation and synthesis.

This is a big problem for children's learning: no one can use those big skills without having some meaty history to apply them to. Especially, "contextualization" means figuring out how a particular primary document relates to a bigger historical situation--which means you can't do it at all until you've learn a bunch of history.

It's also a big problem for students preparing for citizenship: They really do need to recognize the main outlines of what happened in their state, country, and world before they were born, in order to join the debates about what should happen next. 

And it will be a problem for many who participate in our political community.  Have you heard recently about activists who argue that the new AP U.S. History standards omit too many important parts of our shared heritage? Having also read the APUSH standards, I think those critics are wrong.  But if the same folks criticize these draft Kentucky standards for the same kind of omissions, they will be right.  Those who have worked for decades to ensure that our children understand that our heritage includes the diverse experience and diverse contributions of America's indigenous peoples, by African-Americans, and by more recent immigrant groups, will be just as frustrated.

Finally, these draft standards could be taught equally well in Oregon, Uruguay, or Oman: they're not designed to equip citizens of Kentucky and the United States for the work of participating here. I think that's a mistake.

--Posted by Susan Perkins Weston


Friday, October 10, 2014

EdTrust: Kentucky Accountability Signals Are Weak on Achievement Gaps

 
"Average math proficiency rates of African American students at schools earning a Distinguished rating are lower than average math proficiency rates of white students in Needs Improvement schools."
"Similarly, between 2012 and 2013 in Kentucky, reading proficiency rates for African American students declined at about 40 percent of Distinguished schools with data for this group. Math proficiency rates fell at about the same share of top-rated schools."

Both the chart and the quotes are from a new Education Trust report, "Making Sure all Children Matter: Getting School Accountability Signals Right."  In Kentucky, Florida, and Minnesota, EdTrust checked whether strong ratings school like "Distinguished" reflected strong achievement for students from historically under-served groups.  In all three states, they found good reason for concern that "a high rating despite low performance for some groups paints a false picture of success and allows schools to overlook some students."

I join EdTrust in counting this issue as very important, and I want to add two Kentucky-specific thoughts.

No, the Gap Group does not ensure good signals about results for Kentucky's minority students. In Kentucky's accountability system, a school's overall score includes separate attention to a Gap Group that combines students with low family incomes, disabilities, limited English proficiency, and minority backgrounds.  However, because Kentucky has so many low-income (free/reduced meal) students, results for that one group dominate the combined results. Groups with weaker results than the low-income group effectively disappear.  You can see the disappearance happening in my recent PrichBlog post on "2014 Achievement Gaps," showing that the Gap score matches what's happening for low-income students and hides what's happening for the others. So, no, the Gap Group does not signal the importance of results for other groups of under-served students.

No, the rules on "Focus Schools" do not ensure good signals about results for minority students. Yes, Kentucky's accountability regulation says that if a school has a student subgroup with results like the bottom 1% of students statewide, it must be identified as a Focus School.  And yes, the regulation says that Focus Schools cannot be rated as Distinguished.  But in 2013, the Kentucky Department of Education decided not to follow those rules.  So, no, the Focus School rules do not reliably signal major gap problems. And also, no, major gap problems do not exclude Kentucky schools from being publicly identified as Distinguished.

EdTrust's report concludes:
Our hope is that this analysis will prompt policymakers, advocates, and educators to put equity squarely back on the table in each and every conversation about accountability. The Secretary of Education can re-start that focus by making group performance matter in the upcoming waiver renewal process.
I second that hope and add that the Kentucky Board of Education has independent authority to ensure that all children matter in Kentucky accountability, with or without Secretary Duncan's prodding.

--Posted By Susan Perkins Weston

Sunday, October 5, 2014

Kentucky's Jump In Scores: Where Did It Come From?

In Kentucky's accountability system, an overall score combines many kinds of data.  Program reviews are the newest elements, with several kinds of test scores and graduation rates having been considered since 2012.  So when we note that, statewide, scores moved up at the elementary, middle, and high school levels –and moved by more than four points at each level–it makes sense to how much each element contributed.

For example, the statewide elementary overall score grew from 64.2 to 68.7, and the graph below breaks that growth down into parts:

Similarly, the middle school overall score rose from 62.0 to 66.0, with these contributions from different elements:

And high school improvement from 66.8 to 71.3 included this combination of elements.


If you want to think through the arithmetic (not everyone does), the Kentucky Board of Education has set rules on how much each component should count toward the overall score. If you remember a teacher saying "the final exam will be 25% of your grade for the course," you've heard this kind of math before.

For example, the high school formula says that program reviews are worth 23%, and each of the other elements is worth 15.4%.  In the chart above, the 2014 bar shows 23.0 points because statewide, the high school program review score was a perfect 100, and 100 times 23% yields 23 points.  The other elements are smaller because those scores were less perfect, though you can see that achievement, gap group, readiness, and graduation all improved.

More broadly, you can see that program reviews contributed importantly to the growth from 2013 to 2014, contributing 2.1 points for high schools, 3.3 points for middle schools, and 3.2 points at the elementary school level.

Friday, October 3, 2014

2014 Achievement Gaps

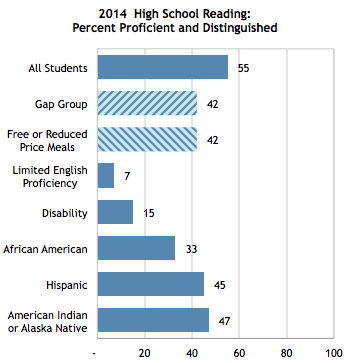
Kentucky still has substantial statewide achievement gaps to wrestle, starting with elementary reading.


In addition to seeing that the gaps are large, do note three other parts of the pattern:
  • The gap group has the same level of proficiency as the free and reduced-price meal group. (The gap group includes all students in the six other under-served groups shown above.)
  • Students with limited English proficiency have the lowest scores, followed by students with disabilities.
  • American Indian or Alaska native students have the highest scores of these groups, followed by Hispanic students
  • Every sub-group scores below the all students results, and only American Indian or Alaska Native students get within five points.
Here's that same pattern for middle school reading, differing only in there being no groups with a gap smaller than five points.
And it is again for high school reading, again with all gaps larger than five points.
A complete set of graphs would make a massive post, so I'll settle for noting that these patterns are amazingly consistent. Across all six tested subjects (reading, math, science, social studies, writing, and language mechanics) and at all three levels:
  • The gap group has the same level of proficiency as the free and reduced-price meal group, except that the two are one point apart in elementary social studies and writing and in high school language mechanics. 
  • Students with limited English proficiency have the lowest scores, followed by students with disabilities, except that they switch places in high school mathematics whild still the two lowest scoring groups.
  • American Indian/Alaska native students have the highest scores of these groups, followed by Hispanic students, except that they are tied in high school science and writing and switch places in middle school writing.  
  • All of these groups have results below the "all students" group, except that American Indian and Alaska native students match all students in elementary social studies and outscore all students in high school social studies.  American Indian and Alaska native students also have results within five points of all students in seven other cases, but are the only group to get that close.
--Posted by Susan Perkins Weston

Note to our readers who receive the blog by e-mail: are the graphs in the post above included in your e-mail versions? Let us know by posting a comment or sending an e-mail to the Prichard Committee office? 

Draft Social Studies Standards!

Next Tuesday, the Kentucky Board of Education will discuss the draft of new standards for Kentucky social studies, and the draft is now publicly available as part of the KBE meeting material.

You can download just the standards or see the full board meeting materials, including information on how the standards were developed and how the state regulation will be amended to include them.

Check them out, and do share your thoughts!

2014 Accountability: Summarizing Some Impressive Results

PrichBlog now has a six-part summary of the strong 2014 statewide accountability results released earlier today, including:
  • Overall scores are up more than four points for all three levels of schools
  • Achievement and gap group results showed consistent improvement.
  • Growth results, with an explanation of why those scores will stay very close to 60 over time.
  • Readiness results are up for middle schools and up more for high schools.
  • Graduation rates are up, whether a four-year or a five-year rate is used.
  • Program review results now average at the fully proficient level for all three subjects at all three levels.
For each school and district, school report cards are also available, using this link and then choosing the reports you want to see.

Overall, it's quite a good year.  Naturally, there's still a great deal of work ahead, and in a few hours, I'll start working on understanding how the new results relate to  classic PrichBlog concerns.  I'll share as I learn.

--Posted by Susan Perkins Weston

Program Reviews as the Newest Accountabilty Element

Program reviews are a new indicator of the quality of student learning opportunities in subjects that Kentucky no longer tests.  For accountability, there are three reviews, focused respectively on writing, arts & humanities, and practical living & career studies.  And, as you can see,when the school scores submitted by all districts are combined into statewide numbers, they average out very high.

It's worth unpacking those results from the statewide briefing packet on the new results a little more.  Individual program review rubrics use a 0 to 12 scale, with 8 being the score for a proficient program.  To get numbers like the ones shown above, the scores on all three reviews are added together and divided by 24 (equivalent to three proficient scores).  Scores above the 100 level are rounded down to the 100 maximum allowed by the state scoring system.

So, the graph above shows that statewide, districts on average are rating their schools proficient or higher on their program reviews.  Individual schools had higher and lower scores, but the averages came out at or above 100 on all three levels.

Below, you can see the results for each subject for the two available years, all using the 0 to 12 scale that applies for individual reviews.  There, too, it's clear that the averages are now at or slightly above the proficient level for all three programs at all three levels.


In 2008, the discussion about program reviews included clarity that the Kentucky Department of Education would need to play a major role in ensuring consistent scoring, along with consistent refusal to estimate the costs.  In 2009, Senate Bill 1 specified "Each local district shall do an annual program review and the Department of Education shall conduct a program review of every school's program within a two (2) year period," again without frank engagement about the price tag.    Since that point, the Department has had no resources to carry out that scale of review, and many discussions have fallen into saying that schools score themselves, even though state law makes the reviews a district obligation. 

Whoever has been leading the process and whoever has been monitoring, I think these results will move us quickly to a serious discussion about what it will really take to ensure that program reviews reflect consistent scoring against high expectations.  That discussion is at least six years overdue.

--Posted by Susan Perkins Weston


Graduation Rates Move Steadily Up

2014 is Kentucky's second year counting adjusted cohort graduation rates as part of accountability scores. Cohort rates tracks students from when they enter high school to when they were expected to graduate.

Last year, school report cards showed a four-year rate, showing how that 86.1% fall 2009 first-time ninth graders graduated by the spring of 2013.  In the 2014 statewide report, there are two numbers. The four-year rate is for the class that started in fall 2010, while the five-year rate is an update on the fall 2009 entrants--showing that another 1.8% of them collected diplomas in the last year.
The statewide school report card notes that "The five‐year adjusted cohort graduation rate is used in accountability calculations," which is an innovation since last year.

--Posted by Susan Perkins Weston

Readiness As An Accountability Component

In the 2014 overall scores released today, readiness is an element for middle schools and high schools.  Those results are broken out below, with some explanation below the graph.

For middle schools, readiness means readiness for high schools success, while for high schol, it means readiness means readiness for college, career, or both.

The middle school results use a single measure: the percent of students who reach benchmark scores in English, mathematics, reading, and science on the eighth grade Explore test.  Explore is a test developed by ACT, Inc., and the benchmark scores were also set by the ACT company.

The high school results reflect multiple measures. Students can show college readiness by meeting  ACT benchmarks set by Kentucky's Council on Postsecondary Education or required scores on college placement tests.   One important detail:  there are CPE  benchmarks for ACT English, mathematics, and reading, but not science, so ACT science is not part of the college readiness definition.  Students can also show career readiness in a variety of ways, and students can be counted as ready for college only, ready for career only, or ready for both.

The chart below shows a little more about Kentucky's high school progress in the past year.  We had a small downturn in the number of graduates, but a clear increase of more than 2,500 students who qualified as college ready and a similar jump in those who are career ready, with a total jump of almost 3,500 in the number meeting one or both standards.  Overall, it's quite an impressive improvement!


--Posted by Susan Perkins Weston

Growth Results and Why They Don't Grow

The 2014 overall scores released early this morning include growth results, identified by comparing students' reading and math performance to that of other students with similar scores last year. 

The state Briefing Packet for this year's accountability release says:
The student growth percentile model (SGP) is based on a normative distribution of academic peer group. Since SGP model uses a normative distribution, the percent of students statewide scoring at the typical or higher level will be consistent from year to year at approximately 60 percent. At the individual school level students scoring at typical or higher level range from 14 percent to 89 percent.
I can explain this a little further.   Kentucky's student growth percentile model identifies groups of students who had similar scores on the previous year's assessments (creating those "academic peer groups").  Then, with the current year's results, the bottom 40% within the group are noted as not making typical progress, while the rest are identified as making typical growth.  For all the groups combined, and for the state as a whole, that means the growth component will always come in right below that 60% ceiling.

An individual school can have more than 60% of students making the progress defined as typical for that year--so long as some other school has less than 60%.  Or one school can have less than 60% if another has more.  But when looking at statewide results, it's not a fluke that the results are going to be very similar every year: that's exactly how the model is designed to work.

--Posted by Susan Perkins Weston

Achievement and Gap Details

For the state as a whole, overall scores moved up by four points of more at each level.  That overall score, in turn, reflected a set of component results, available in the statewide school report card, and starting with the two components shown below.
The achievement score uses a weighted formula to combine K-PREP results for reading, mathematics, science, social studies, writing, and language mechanics.  Schools get full credit for students who score proficient or distinguished, partial credit for students who score apprentice, and extra credit if the number of proficient students is higher than the number at the novice level.

The gap group score combines the same six subjects, but looks only at students who make it to proficient or distinguished, without any partial or extra credit, and only at students from historically under-served groups: low income, limited English, students with disabilities, and students from African American, Hispanic, and American Indian/Native American backgrounds.

If we continue this pace of improvement, we can expect to see all  students fully on track for college and career readiness--as shown by reaching a full 100--within:
  • 10 years for elementary achievement/all students and 17 years for elementary gap group.
  • 18 years for middle school achievement and 29 for middle gap group.
  • 29 for high school achievement and 54 for gap group.
To me, those numbers signal that what we're seeing for 2014 is both good and not good enough.

--Posted by Susan Perkins Weston


2014 Overall Results: Wow!


Kentucky's 2014 accountability results, released at midnight, show an impressive one-year step up in how our schools serve our kids, with growth of four or more points at every level.  In Kentucky's accountability system, the overall score combines:

■ Achievement based on K-­‐PREP results in all subjects for all students
■ Gap Group based on K-­‐PREP results in all tested subjects for students who receive free or reduced price lunches, students with disabilities or limited English proficiency, and African-­‐American, Hispanic, and American Indian/Native American students
■ Growth results based on students’ progress in reading and mathematics
■ Readiness results based on Explore, Plan, ACT, and other evidence of readiness for college and career (used only for middle and high schools)
■ Graduation rates (for high schools only)
■ Program review results (added for the first time this year)

This year's improvement isn't all the improvement we need, but it's a really important showing of  how our students and our teachers can make rapid progress!

--Posted by Susan Perkins Weston

Wednesday, October 1, 2014

Three quick notes for a busy morning...

1.  Student voices, teacher explanations, and learning success, are all part of this great CN2 report on Boyle County strategies!


2. "Exercise is ADHD Medication" at The Atlantic website starts from multiple studies on the brain benefits of physical activity and builds up to justified frustration with schools and communities that still aren't rebuilding students' opportunities to move and become ready to learn.

3. Current federal law mandates reading and math testing every year from grade 3 to grade 8, but recently filed legislation could give states more flexibility, requiring them to test either reading or math in each of those grades.  Representative Stephen Israel (NY) filed the bill with support from the American Federation of Teachers, and details are included in this EdWeek blogpost.


Monday, September 29, 2014

School results coming soon: now with program review data

Friday, October 3rd, is now the scheduled date for 2014 accountability results to be released to the public, and the 2014 school report cards will include program reviews as an additional source of evidence about how students are being served.

Kentucky uses program reviews to check on the quality of students' learning opportunities in subjects that we no longer test, including arts and humanities, practical living and career studies, and writing of the sustained kind that is not easily measured by brief standardized assessments.

The Kentucky EdGuide on "Quality of Learning Programs" explains that:
[A] program review is defined as “a systematic method of analyzing components of an instructional program, including instructional practices, aligned and enacted curriculum, student work samples, formative and summative assessments, professional development and support services, and administrative support and monitoring.” 

Each program review looks at multiple aspects of a school’s program, using a rubric organized around standards for the program and “demonstrators” of strong quality on that standard. For each demonstrator, a school’s program can be scored 0 (no implementation), 1 (needs improvement), 2 (proficient), or 3 (distinguished), based on more detailed characteristics found in the rubric.
You can learn more about program reviews by downloading the EdGuide or by taking a look at the program review rubrics schools use to score themselves.

Many schools' 2014 overall scores may look better now that program reviews are included. 

I say that because we already know how 2013 overall scores would have looked with program reviews factored in, and most scores definitely would have been higher.  In the chart below, you can see examples of the impact.   The lighter bars show the statewide overall scores for each level from the 2013 state report card (without program review data), and the darker ones show the Department of Education's calculation of the same overall scores with program review data included.  The revised versions look stronger because, in general, schools' program review scores are stronger than their state test scores and graduation rates.

However, it is important to know that 2014 accountability will be an apples-to-apples comparison.  Program reviews were included when schools' 2014 annual measurable objectives were set, and they were included in defining the 2014 scores that will qualify a school for a particular percentile rank and accountability classification. 

Source note: the 2013 overall scores that include program review data can be found in the Accountability section of KDE's Open House portal, in a file that also shows the 2013-14 annual measurable objectives for improving on the 2012-13 results.

--Posted by Susan Perkins Weston


Sunday, September 28, 2014

Will better math tests be good enough?

PARCC and Smarter Balanced are the two multistate consortia working on new assessments for the Common Core State Standards. After four years of design and pilot testing and field testing, they're nearly ready for prime-time use--meaning administration to large groups of students for use in statewide accountability systems.  Since Kentucky hasn't chosen to use either assessment yet, I've been noticing news about both, including a rising debate about the ways they approach mathematics.

The consortia argue that their new versions are definitely better than existing multiple choice math tests because of new on-line options.  As an EdWeek report recently summarized:
Unlike previous state assessments, those being developed by the two federally funded consortia will include complex, multipart word problems that students will answer on screen. While some of those questions will provide built-in tools that allow students to put points on a graph or draw lines on a ready-made picture, other questions will ask them to write their answers in narrative form, using a keyboard.
But others argue that the computer tools still aren't close enough to the real work of using math to solve problems.  In the same EdWeek account, David Foster of the Silicon Valley Mathematics Initiative shared his concerns:
"I'm a mathematician, and I never solve problems by merely sitting at the keyboard. I have to take out paper and pencil and sketch and doodle and tinker around and draw charts," he said. "Of course, I use spreadsheets all the time, but I don't even start a spreadsheet until I know what I want to put in the cells.

"All Smarter Balanced and PARCC are going to look at is the final explanation that is written down," he said, "and if there's a flaw in the logic, there's no way to award kids for the work they really did and thought about."
Mr. Foster added: "I've played with the platform, and it makes me sick. And I've done it with problems I've written."
I'm suspect they're both right.  PARCC and Smarter Balanced are offering some big steps forward in how students answer math prompts, and yet they are also far from inviting students to use math in ways that are close to real life applications on the job, in the home, or in civic life.

For the long-term education discussion, this debate turns yet another spotlight on an enduring puzzle: how can schools develop a balanced commitment to the skills that are easy to measure and the skills that matter at least as much but don't fit easily into standardized assessments?

Do note that Kentucky is not signed up to use either PARCC or Smarter Balanced.  Our current K-PREP assessments use methods that were in use years before we adopted Common Core, and any changes from that will occur when the Department of Education seeks new bids for our testing contracts.  The consortia will be eligible to submit proposals, in open competition with other companies that think they can provide the data we need.

--Posted by Susan Perkins Weston

Wednesday, September 24, 2014

International Benchmarks for Kentucky Scoring

If Kentucky 2011 students had taken the international TIMSS and PIRLS assessments, the American Institutes of Research estimates that:
  • 46% of Kentucky fourth graders would have reached the high benchmark in mathematics (in a system that gives scores of low, intermediate, high, and advanced)
  • 60% of Kentucky fourth graders would have reached the high benchmark in reading
  • 27% of Kentucky eighth graders would have reached the high benchmark in mathematics
AIR used a "chain linking" method to develop those estimates, reported in a new report on International Benchmarking: State and National Education Performance Standards.

The report also shares analysis of how Kentucky defined proficient work on the old KCCT assessment and the new K-PREP tests.  On the old test, Kentucky's proficient lined up with TIMSS and PIRLS scores of at the intermediate level.  In our new system, launched in 2012, AIR concludes that Kentucky proficient lines up with the high score level on the international assessments.  That's an excellent step up for helping us understand how our students' learning compares to success rates around the globe!

--Posted by Susan Perkins Weston