
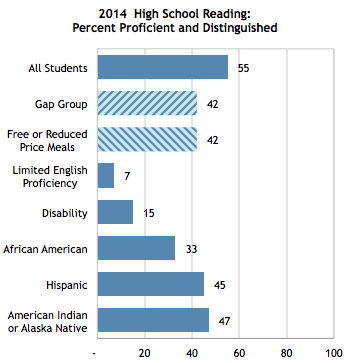
- The gap group has the same level of proficiency as the free and reduced-price meal group. (The gap group includes all students in the six other under-served groups shown above.)
- Students with limited English proficiency have the lowest scores, followed by students with disabilities.
- American Indian or Alaska native students have the highest scores of these groups, followed by Hispanic students
- Every sub-group scores below the all students results, and only American Indian or Alaska Native students get within five points.

- The gap group has the same level of proficiency as the free and reduced-price meal group, except that the two are one point apart in elementary social studies and writing and in high school language mechanics.
- Students with limited English proficiency have the lowest scores, followed by students with disabilities, except that they switch places in high school mathematics whild still the two lowest scoring groups.
- American Indian/Alaska native students have the highest scores of these groups, followed by Hispanic students, except that they are tied in high school science and writing and switch places in middle school writing.
- All of these groups have results below the "all students" group, except that American Indian and Alaska native students match all students in elementary social studies and outscore all students in high school social studies. American Indian and Alaska native students also have results within five points of all students in seven other cases, but are the only group to get that close.
--Posted by Susan Perkins Weston
Note to our readers who receive the blog by e-mail: are the graphs in the post above included in your e-mail versions? Let us know by posting a comment or sending an e-mail to the Prichard Committee office?
No comments:
Post a Comment
Updates and data on Kentucky education!