Tuesday, January 11, 2011

In teams and with tasks: Richard Elmore

Okay, so my favorite educators have been telling me to learn from Richard Elmore for years, and I finally got a start last week, starting with an excellent interview available here.  Professor Elmore is based at Harvard, working on leadership and culture issues that change student performance or keep it from changing, and in this piece, he offers "two big, bold-letter findings."

TEAMS
The first big finding emphasizes the need for people inside a school to pull together.  Until they do, Dr. Elmore argues, they cannot mount any effective response to outside accountability.  He argues:
You can get an organization’s attention through testing and feeding back test scores against standards. You can even reinforce that with various kinds of sanctions and support. You can categorize schools, you can penalize schools and you can provide extra resources and so on. But none of that is going to work unless the school has developed its internal capacity to hold the adults and the kids accountable to each other.
That overlaps nicely with PrichBlog's obsessive concern with professional learning communities and collaboration to build teaching quality.

TASKS AS WHAT TEAMS MUST ADDRESS
The second big finding is that even excellent organization work is not enough.  Dr. Elmore sets up the problem by pointing out that:
You can have the internal capacity. You can have strong, well-informed leadership, teachers working in teams, external support and professional development, coherent curriculum, a school improvement plan – everything the literature tells us we should have – and yet not be getting the expected growth. Or, what many schools experience is that you get initial growth, but then the line goes flat.
His argument is that what's happening is that students are still being given tasks that don't allow them to develop the higher performance levels we need.  Educators chose to keep the work simple, predictable, easy to control and guide and grade–and the result is that students do not grow nearly as much as they could with greater challenges.

An Elmore catch phrase is that "task predicts performance."  I think I understand that.  If you ask me to peel vegetables, that's only going to give me a small step toward becoming a competent cook.  If you assign me to walk around the block daily, that will never get me into shape for a marathon.   And if you give me worksheets and drills and lists of facts to remember, that isn't going to equip me to analyze demanding texts, build strong arguments from credible evidence, or tackle serious math and science challenges effectively.

In short, the team effort is necessary but insufficient: the team will not produce major achievement gains until it focuses on the "instructional core" and the changes needed to put students to work at much higher levels.

I've got more reading to do, including a book that arrived in Saturday's mail, but I heartily recommend the interview, titled "Leading the Instructional Core," and published by the Ontario Ministry of Education

Monday, January 10, 2011

Fewer, clearer, deeper: Advanced Placement edition

Next month, the [College Board] will release a wholesale revamping of A.P. biology as well as United States history — with 387,000 test-takers the most popular A.P. subject. A preview of the changes shows that the board will slash the amount of material students need to know for the tests and provide, for the first time, a curriculum framework for what courses should look like. The goal is to clear students’ minds to focus on bigger concepts and stimulate more analytic thinking. In biology, a host of more creative, hands-on experiments are intended to help students think more like scientists.
That's from the New York Times, which also reports that the College Board's timetable calls for:

  • The 2011 tests to reflect similar changes in German and French that were already announced.
  • The 2013 tests to reflect those biology and U.S. history changes.
  • The 2014 or 2015 tests to show related shifts for physics, chemistry, European history, world history, and art history.
The article shares details of an overloaded curriculum, jammed with so many details that the big picture and the key skills get crowded out.   As a mark of the skill problem, Massachusetts Institute of Technology found that even students scoring a 5 on the Biology test lacked the problem solving skills they needed for higher-level courses –and stopped offering credit based on those scores. 

Here's a thought.  As P-12 education works toward shared standards for science and history at the lower levels, could we work backward from AP's outlines?  If we planned high school, middle school, and elementary work to lay strong foundations for students to take AP courses, would we put students on track to be ready for college and career?

The full article, with more about the pending changes and multiple positive responses from practicing educators, is here.

Against revolutionary folly

Here's a bad argument: "No serious change can happen without full-blown revolution.  Until we change our whole economic structure, no important reform will be possible."

If I heard that once in my college years, I heard it a hundred times.  Maybe half the people who tried it out meant to align themselves with Marxist analysis, and the rest were offering some other form of radical thinking.

If I heard it a hundred times, I never believed it once.  I knew too much about the forward march of individual liberty, abolition, voting rights and civil rights.  I knew too much about how Jim Crow fell, and too much about the strategies of decency and solidarity that were even then eroding both white rule in South Africa and communist rule across eastern Europe.  I knew much too well that smart and steady work by committed individuals can indeed generate worthwhile change.

I haven't heard that revolution-or-bust rhetoric much in the last two decades, but I have heard something close.

The argument that comes close says this: "Schools can't change student performance unless we eliminate poverty and racism first."

The Washington Post published a piece today that tries that tired approach.  This time, Robert Samuelson points out that American white students do about as well on the PISA test as largely white countries like Canada, Australia, and New Zealand.  Then he adds that our national weakness can be traced to the weaker performance of other American children, especially those who are black and Hispanic. His argument is that:
These persistent achievement gaps demonstrate the limits of schools to compensate for problems outside the classroom - broken homes, street violence, indifference to education - that discourage learning and inhibit teaching....What we face is not an engineering problem; it's overcoming the legacy of history and culture. 
Yet again, the claim is that educational progress is essentially impossible without radical change to other institutions.

The problem with that position is that it ignores the data.  It cannot account for all the examples of schools that deliver student progress right in the teeth of the poverty odds.   It cannot escape the systematic evidence that key changes in instructional practices can raise achievement and narrow those haunting gaps.  And it cannot explain how other countries, many with ugly history of their own, are successfully changing their futures by changing their education systems.

This kind of argument looks erudite, but it's ignorant.  It sounds sophisticated, but it's crude and false.  It mimics past version of revolutionary talk remarkable well, and its case for radical despair is just as mistaken this time as it was in decades past.

The way to defeat this sort of willful despair is by doing the work they say is impossible, educating the children they say are doomed, and building the society they say is out of reach.

Saturday, January 8, 2011

Civics 101


(Posted while hearing reports that Congresswoman Gifford has come through surgery and doctors are "as hopeful as possible under the circumstances" for her recovery from the bullet wound she received today while meeting with her peacably assembled constituents.)

State funding cuts (some context)

SEEK funds to school districts will be cut for the remainder of this year, by roughly $50 million.

That translates to about $85 per student. It's about 2 percent of previously promised funding from the state, and about 1 percent of total funding per year.

Commissioner Terry Holliday, in announcing the cuts, pointed out that federal EduJobs funding of about $150 million dollars will enable districts to cover this loss without immediate cuts.

These cuts reflect growing local needs, rather than shrinking state revenue.  SEEK funding is allocated based on average daily attendance, and that ADA count appears to be 10,000 higher than expected.  In addition, local property tax revenue is down, and under the SEEK formula, that makes the state responsible for more of the base guarantee.

Watch closely for the impact on next school year.  The budget passed last year promised that SEEK funding would go up for 2011-12, but that assumed a lower ADA.  If ADA stays this high or goes higher, that promise will be very hard to keep.

Finally, remember that property tax revenues do not go down instantly in a recession: some properties that lose value wait one or more years before the official assessment is reduced.  If we've seen a one-year decline in property revenues, we may have several more years of decline ahead.

Thus far, Kentucky education funding has taken much less damage than some other states during this horrible recession.  This week's news suggests that the most important damage may still be to come.

Thursday, January 6, 2011

University growth (by location)

Following up on earlier posts on overall and KCTCS growth in undergraduate enrollment, here's a quick look at the public universities.  Again, I've sorted from smallest to largest growth.


Check out Western Kentucky University, growing 30 percent in full-time-equivalent undergraduate enrollment.  As shown in the pie below, Western also provides 28 percent of the total undergraduate FTE growth for the four-year institutions.

Wednesday, January 5, 2011

Supporting instruction: literacy modules, courses, and construction in progress

In describing the literacy tools being developed by the Gates Foundation, I've focused so far on the template tasks and on the skill and mini-task elements of the instructional design.  Those pieces are also meant to provide building blocks for some bigger efforts.

MODULES AROUND TASKS
Participating teachers are asked to develop their work into modules that can be shared more widely. A full module identifies:

  • The content standards the students will be learning, both the science, history, or other topic and the literacy standards from the Common Core
  • A teaching task created by filling in one of the LDC template tasks.
  • The skills students need.
  • The mini-tasks to build those skills.
  • The needed results, showing samples of the student work that meets the expectations for the overall teaching task.

With standards shared across the country, the idea is for educators also to share their module designs from school to school and from state to state.

COURSE DESIGNS AROUND MODULES
There's also thinking underway about full courses that include a sequence of modules, so that central elements of a year's classroom content would be taught through a series of these intensive teaching tasks.


CONSTRUCTION WORK IN PROGRESS
Having shared this much from the Supporting Instruction monograph and our Kentucky experience, it's worth slowing down to clarify where this design stands.

The templates are ready for early use, and small groups of teachers are just now launching that use, filling in their own classroom content and trying out the instructional strategies, the rubrics, and the shared scoring options.  The very first modules have been taught and are being refined based on initial experiences with the methods.  That's what roughly fifty Kentucky participants are exploring right now under the Prichard Committee's grant for this work, along with teams from a handful of districts elsewhere and some related organizations that develop instructional strategies.

Building out a library of modules and an array of course designs is part of the plan, but implementing that plan has only just begun.

COMPLEX TEXT AS THE MAIN GOAL
An LDC module, as described above and in the earlier posts, spread over about two weeks, can be a powerful investment in building science literacy in science classrooms, history literacy in history classrooms, and overall capacity to handle complex texts in middle and high school classrooms across the country.  If tackling those complex texts is the core added skill American students need for future success, this design is a serious bid to support the teaching of that exact type of skill.

KCTCS growth (by location)

Yesterday's post noted our rapid growth in undergraduate full-time equivalent enrollment, with KCTCS growing the fastest and adding fully half of the total expansion.  Below, check out the enrollment by campus, sorted from smallest to largest number of students added.  Hazard had a very small decline, while all others grew, and the Somerset and Jefferson campuses each generated 12 percent of the system-wide growth.

Tuesday, January 4, 2011

Seeing our higher education growth (FTE edition)

Kentucky higher education has grown rapidly in recent years. With a lot of students attending part-time, it's worthwhile to adjust to "full-time equivalents" to get a clearer idea of how much added learning activity is underway and where it's happening.

First, here are the core numbers from the Council on Postsecondary Education, broken down by type of school.

Second, to give you a sense of the pace, the growth rates are:

  • 27 percent overall
  • 17 percent at the public universities
  • 27 percent at independent colleges and universities
  • 47 percent (!!) at the Kentucky Community and Technical College System

Finally, to give you one more visual of the growth, notice how KCTCS takes up half of the growth pie shown below.

Supporting instruction: the teaching around the literacy tasks

The Literacy Design Collaborative strategy discusses in yesterday's post starts with the template tasks and then backs them up with an instructional design.

That instructional design provides "mini-tasks" for each of the key skills students will need.   For a particular task, the reading skills might be:

  • selecting relevant and credible texts
  • analyzing essential vocabulary
  • taking notes
  • sorting through those notes to identify central points.  

The Supporting Instruction monograph comes with examples of mini-task prompts, including four that build those four skills, followed by the kind of product students will produce:
Because the teacher applies a simple scoring rubric to each prompt, the mini-tasks have a powerful feedback loop. The student learns quickly what to improve, and the teacher also sees clearly which areas need further support.

Some key point to note about this approach:

  • The template tasks are teaching tasks: they are meant to be used in the process of classroom learning, rather than as an outside measure separate from the instructional process.  
  • In keeping with that focus, the LDC assumption is that teachers can and should make professional judgment about which skills their own students need and about which mini-tasks will build those skills most effectively.  The design offers a prototype list of skills and mini-tasks, but innovation at the classroom level is built into the expectations.
  • The design illustrates formative assessment practices in active use: both students and teachers are actively figuring out how to take the right next steps to deeper understanding and higher performance.

Further illustrations of the template tasks and the mini-task design can be downloaded here.  Earlier PrichBlog posts on the Gates Foundation's investments in supporting instruction around the Common Core Standards are here, here, here, and here, with the press releases on participation by Kentucky teachers and the Prichard Committee here and here.

Sunday, January 2, 2011

Supporting instruction: the literacy tasks

To succeed in higher education and demanding future jobs, all students must be ready to work with complex texts in many subjects. The Common Core Standards emphasize this point repeatedly, including separate standards for science literacy and history/social studies literacy and using exemplar texts from multiple disciplines. To support those Standards, the Gates Foundation is investing in a Literacy Design Collaborative (or LDC) strategy designed for use across grades six to twelve and in science, history, English, and other studies. That approach is outlined in the Supporting Instruction monograph, alongside the mathematics strategy I discussed in earlier posts here and here.

The LDC strategy starts from template tasks that teachers can fill in with curriculum content from varied subjects. For example, here’s a template task that leads to an argumentative writing piece:
Task 4 Template: [Insert essential question] After reading _______ (literature or informational texts), write an _______ (essay or substitute) that compares _______ (content) and argues _______ (content). Be sure to support your position with evidence from the texts.
In turn, that task can be filled in with content from varied disciplines.  Consider these three different versions:
English Language Arts What makes something funny? After reading selections from Mark Twain and Dave Barry, write a review that compares their humor and explains which type of humor works for a contemporary audience and why. Be sure to support your position with evidence from the texts.
Social Studies Do presidential policies really make a difference in the lives of Americans? After reading primary and secondary sources, write an essay that compares John F. Kennedy’s New Frontier social policies with Lyndon Johnson’s Great Society social policies and argues which had a more significant impact on Americans. Be sure to support your position with evidence from the texts.
Science Which is the better energy source? After reading scientific sources, write an essay that compares the chemistry involved in producing nuclear energy and fossil fuels and argues which is the better energy source for urban communities. Be sure to support your position with evidence from the texts.
All three tasks lead to student work that can be scored against a common rubric, allowing teachers to work together on shared scoring and ongoing discussion of how to help students move forward.  A central point of the LDC strategy is to make literacy a central issue both in classrooms and in teacher collaboration across the middle and high school years. ( Examples of other argumentative and informational template tasks are available here)

Those template tasks are the cornerstone of the LDC strategy. Around that cornerstone, there’s a further teaching strategy, and building on that foundation, there’s a vision of restructured overall curriculum—but those are topics best addressed in my next few posts.

Supporting math instruction (a bit more)

Yesterday's post focused on mathematics formative assessment lessons being developed to support the Common Core State Standards.  To put those FALs in context, here's a bit more.

First, where do FALs fit into an overall curriculum? 
The Supporting Instruction monograph emphasizes the flexible options:
The FALs are intended to be used by teachers every couple of weeks or so as part of their courses. Individual teachers or districts can decide exactly how each FAL will be used. Some teachers, for example, could use one FAL to introduce a math topic, and other teachers might use it two-thirds of the way through their teaching of the topic to raise questions and check for further understanding, or some weeks later to consolidate learning.
Second, where (literally) are the FALs being used in Kentucky? 
Under the Gates Foundation's math grant to the Prichard Committee, Boone, Daviess, Jefferson, Jessamine, Kenton, and Warren County ninth and tenth grade teachers (and some eighth grade teachers as well) spent last spring in intensive professional development around formative assessment strategies for overall classroom instruction. This fall, they have begun using the FALs directly, with plans to explore how the overall curriculum can use those lessons systematically to deliver on the Commmon Core.  Their accounts of classroom success add to my excitement about these new tools for deeper mathematics learning.

Saturday, January 1, 2011

Supporting Instruction: Mathematics

The new Supporting Instruction monograph from the Gates Foundation describes the new "formative assessment lessons" being developed to help students learn and teachers teach the new Common Core mathematics standards for grades 7 through 10.  Those "FALs" are being designed by the Shell Centre in England and the University of California at Berkeley to support new and intensive attention to mathematical practice.

Each FAL starts with a rich math task and organizes a lesson that draws students into "a productive struggle with the mathematics essential for college readiness."
1) Students are given an easily administered initial assessment task. This provides teachers with a qualitative sense of their students’ grasp of the targeted mathematics.
2) Students are immersed in the mathematics of the initial assessment task through a set of collaborative activities. This part is designed as a guided inquiry. Students work in small groups, engage in discussion, take responsibility for their own learning, and learn from each other, often by examining each other’s work. Teachers provide feedback to move their students’ learning forward.
3) Students are engaged in a whole-class discussion. This is designed to pull the lesson together. Students get to strengthen their understanding while teachers get to deepen their insights into their students’ learning. It provides another opportunity to structure discussion, provide feedback, and allow students to learn from each other.
4) Students return to improve their response to the initial assessment. This gives students a look at what they’ve learned as well as more feedback, while providing teachers perspective on the effectiveness of their teaching.
Three samples of the FALs are available here.

The third sample, called "Solving Pentagons," is one I've tried: I was part of a June "class" of Kentucky educators and administrators who tried that task with guidance from one of the designers for this initiative.  I started with certainty that I'd be unable to do the work, found some starting points when I worked on my own, gained confidence as I puzzled with a team, and realized that when I went back to the task alone, I could indeed work through the challenge.

In writing about Rick Stiggins' call for balanced assessment, I've described the approach as working to create "a virtuous spiral in which students master one step, gain confidence, reach for another step, and cycle upward with growing knowledge, skill, and certainty that they can succeed."  My early taste of these mathematics FALs felt exactly like moving onto that virtuous spiral.  If they work as well for students still in school as the pentagon example did for me, they will make a difference in students' confidence and skill in using the math they will need for higher education and future careers.

(Have I mentioned that I'm excited?)

Happy 2011 literacy and math possibilities

I'm delighted to kick off 2011 with great hopes for some great tools.  The Gates Foundation website now features an overview and samples of the literacy and math strategies it is developing to support the new Common Core State Standards. "Supporting Instruction" explains the overall project this way:
While the standards were being produced, we were also investing in the tools teachers will need to help their students meet them. For the last two years, we’ve been leading two design collaboratives, one in mathematics and one in literacy. These groups have been developing and piloting the formative assessments teachers need to understand where students are relative to the standards, the lessons to move students forward, and the rich classroom-based summative assessments that demonstrate student progress.
In both cases, the design teams are indeed collaboratives and involve subject-matter experts, education leaders, and classroom teachers who keep the effort grounded in real schools and students.
These tools are now being codeveloped and piloted in 14 school districts in 8 states during the current school year, along with a rigorous evaluation process to ensure that they work. It will be several months before we can report on their progress, but we expect to be ready to share “version 1.0” in the 2011–2012 school year.
Yes, Kentucky's one of the eight states doing co-development and piloting, through grants for Prichard Committee work with a small group of educators around the state, described here and here.

And, yes, I've had the privilege and delight of being right in the middle of the convenings where the participating share their early experiences with each strategy.  I think these tools have huge potential to raise student engagement, understanding and achievement in very exciting ways.

You can download the Foundation's monograph here, and I'll blog on the mathematics and the literacy details a little later in the day.

Tuesday, December 21, 2010

Urban districts that deliver (from Broad)

Of 100 large urban districts, which ones deliver achievement above state average for historically disadvantaged students ?

The Broad Foundation did the math and shared its findings. Here's who delivered a higher percent of students meeting state standards than their own state's average for other schools and districts:

African-American, Hispanic, and Low Income Students Above State Average
Elk Grove, CA
Gwinnett County, GA (Winner of the 2010 Broad Prize)
Long Beach, CA
Northside,TX

African-American and Low-Income Students Above State Average
Cobb County, GA
Fairfax County, VA
Garland, TX
Mobile, AL
Montgomery County, MD
San Diego, CA

African-American and Hispanic Students above State Average
Broward County, FL
Charlotte-Mecklenburg, NC
Killeen, TX
Riverside, CA

Hispanic and Low-Income Students Above State Average
Garden Grove, CA
Mesquite, TX
Socorro, TX
Ysleta, TX

African-American Above State Average
Corpus Christi, TX
El Paso, TX
Guilford County, NC
Wake County, NC

Low-Income Above State Average
Alief, TX
Mesa, AZ
San Francisco, CA

Hispanic Above State Average
District of Columbia (compared to "any other schools," including charters)
Miami-Dade County, FL
Saint Paul, MN
Seattle, WA

New York City, Brownsville TX, and Aldine TX were excluded from the analysis because they were the three most recent winners of the Broad Prize and ineligible for the 2010 award.

Monday, December 20, 2010

It happens in teams (Weingarten on football)

In Newsweek's new joint interview of Bill Gates and the AFT's Randi Weingarten, I love this paragraph:
Football teams do this all the time. They look at the tape after every game. Sometimes they do it during the game. They’re constantly deconstructing what is working and what isn’t working. And they’re jettisoning what isn’t working and building up on what is working, and doing it in a teamlike approach. We never do that investment in public schooling. What’s happening in Finland is they do that investment in the graduate schools of education before people become teachers. They recruit a very select group of people who become teachers. Now it is also true that Finland has a 5 percent poverty rate and the United States has a 20 percent poverty rate. But there’s this notion of really figuring out what the best teachers do and trying to scale that up.
That's from Ms. Weingarten, not Mr. Gates.  It's a great interview, with both voices focused on stronger education for America's students.

He's got a sound point about making annual formal evaluations more substantive, reflecting the Gates Foundation's deep investment in measuring effective teaching--an investment that even includes new video tools that produce something very like the game tapes used in football.

She's got a sound point, too.  Her focus is on year-round cycles of continuous improvement organized primarily by professional colleagues. At the school level, teams that work together to build skills and raise results are often called professional learning communities, and attempts to measure that sort of environment are made through surveys on working conditions.  She's also arguing for similar loops on a larger scale, both for preparing teachers and for defining standards, curriculum, and testing methods.

While both takes are important and the two strategies certainly should be deployed, Ms. Weingarten's emphasis on the continuous, team-based feedback process looks to me like the more important part of the total change we need to create.

Sunday, December 19, 2010

Slow blogging ahead

As the year ends, I'm watching the schools starting their breaks, the news slowing down, and my own house filling up with family, friends, and Christmas lights.  PrichBlog will be back with full strength on January 2, but until then posting may be pretty light.

Thursday, December 16, 2010

Kentucky Surges in National Board Certification

The Education Professional Standards Board shares the good news by press release:
Kentucky Ranks 6th Nationally in NBPTS Certification Results
Frankfort, KY.(December 15, 2010)- Teacher quality reaches a new milestone in Kentucky with today’s announcement by the National Board for Professional Teaching Standards (NBPTS) that 316 Kentucky teachers were awarded the prestigious National Board Certification® in the class of 2010. This achievement recognizes these educators as among the top in the nation and promises to improve student learning in classrooms statewide. Kentucky now totals 2,156 NBCTs who have ever attained National Board Certification and is ranked 12th nationally for the total numbers of NBCTs.
Kentucky consistently ranks among the top in the number of new NBCTs. “Kentucky’s National Board Program is considered a model by many other states,” said Dr. Phillip Rogers, Executive Director of the Education Professional Standards Board. “I commend these teachers for their extraordinary commitment to teaching and for achieving the highest credential in the teaching profession.” Upon successful completion of the National Board process, Kentucky teachers currently holding a Rank II certificate are eligible to apply for Rank I and may serve as mentors for new Kentucky NBPTS candidates.
The number of National Board Certified Teachers nationally has increased more than 90 percent over the past five years. Nationwide, 8,600 teachers achieved National Board Certification this year, bringing the total certified up to 91,000. The top ten states with the highest number of teachers achieving National Board Certification this year are North Carolina (2,227), Washington (1,272), Illinois (771), South Carolina (498), California (342), Kentucky (316), Maryland (302), Arkansas (290), Florida (273) and Oklahoma (225).
National Board Certified Teachers are changing the culture of learning in the classrooms, schools and districts. National Board Certification is voluntary and open to all educators who have a baccalaureate degree and three years of classroom experience in either a public or private school. National Board Certification, for veteran teachers, is a rigorous 10-part performance assessment that includes video portfolios, analysis of classroom practice and evaluation of content knowledge. Take One!, for educators at all levels, is professional development organized around the National Board’s professional teaching standards and core propositions. Teachers who have participated in National Board Certification have overwhelmingly stated it is the most powerful professional development experience of their careers.

Funding, curriculum, teaching: Darling-Hammond on high-achieving nations

In the search to understand countries with stronger education results than our own, Linda Darling-Hammond argues that “high flyers all have equitable funding, shared curriculum, and quality teaching.”

In the new issue of American Educator, Dr. Darling-Hammond writes:
These more equitable investments made by high-achieving nations are also steadier and more focused on key elements of the system: the quality of teachers and teaching, the development of curriculum and assessments that encourage ambitious learning by both students and teachers, and the design of schools as learning organizations that support continuous reflection and improvement. With the exception of a few states with enlightened long-term leadership, the United States, by contrast, has failed to maintain focused investments in any of these essential elements.
The result is that the United States is standing still while more focused and steadfast nations move rapidly ahead.
With ample footnotes, she goes on to argue that Finland, Singapore, and South Korea all:

  • “Fund schools adequately and equitably, and add incentives for teaching in high-needs schools.”
  • “Organize teaching around national standards and a core curriculum that focus on higher-order thinking, inquiry, and problem solving through rigorous academic content.”
  • “Eliminated examination systems that had once tracked students into different middle schools and restricted access to high school.”
  • “Use assessments that require in-depth knowledge or content and higher-order skills.”
  • “Invest in strong teacher education programs that recruit top students, completely subsidize their extensive training programs, and pay them a stipend while they learn to teach.”
  • “Pay salaries that are equitable across schools and competitive with other careers, generally comparable to those of engineers.”
  • “Support ongoing teacher learning by ensuring mentoring for beginning teachers and providing 15 to 25 hours a week for all teacher to plan collaboratively and engage n analyses of student learning, lesson study, action research, and observations of one another’s classrooms, which help them continually improve their practice.”

Her article provides rich details for each strategy and important options for future state and national education strategies.  I recommend the full document highly as a starting point for thinking about 2011 and beyond.

Tuesday, December 14, 2010

Measuring effective teachers: the student component

Student perceptions are a serious part of the the giant Measuring Effective Teachers project, already discussed in recent posts here, here, and here.  For that part of the analysis, the study used the Tripod survey, an instrument developed by researcher Ron Ferguson to look at "the extent to which students experience the classroom environment as engaging, demanding, and supportive of their intellectual growth."  The initial MET report confirms the predictive value of that student data:
When a teacher teaches multiple classes, student perceptions of his or her practice are remarkably consistent across different groups of students. Moreover, student perceptions in one class or one academic year predict large differences in student achievement gains in other classes taught by the same teacher, especially in math. In other words, when students report positive classroom experiences, those classrooms tend to achieve greater learning gains, and other classrooms taught by the same teacher appear to do so as well.
Student feedback need not be a popularity contest. We asked detailed questions about various aspects of students’ experience in a given teacher’s classroom. Some questions had a stronger relationship to a teacher’s value-added than others. The most predictive aspects of student perceptions are related to a teacher’s ability to control a classroom and to challenge students with rigorous work.
Students’ perceptions have two other welcome characteristics: They provide a potentially important measure that can be used in nontested grades and subjects. In addition, the information received by the teacher is more specific and actionable than value-added scores or test results alone.
Those results also illustrate two other important aspects of the MET work in progress.  First, the study is looking at how well various indicators predict teachers' ability to raise student results, aiming to find combinations of multiple elements that do even better than the strongest individual components.  Second, the study is looking for useful feedback that gives a teacher concrete ideas of how to change strategies to get higher future results, going beyond simply reporting on whether past results were high enough or added the desired level of value to students past achievements.

Monday, December 13, 2010

Measuring effective teachers: more on who's doing the work

The Measuring Effective Teachers Project involves teachers from Charlotte-Mecklenberg, Dallas, Denver, Hillsborough County (which includes Tampa), Memphis, and New York City, and the work is directed by Thomas Kane and Steven Cantrell of the Bill & Melinda Gates Foundation.

The MET report issued last Friday identifies a wide array of other experts contributing to the effort.  I'm not familiar with every name, but I do see very nearly all the organizations and individuals I've heard Kentucky educators mention as insightful scholars and effective organizations working in this field.

As "lead research partners," the report lists:
  • Mark Atkinson, Teachscape
  • Nancy Caldwell, Westat
  • Ron Ferguson, Harvard University
  • Drew Gitomer, Educational Testing Service
  • Eric Hirsch, New Teacher Center
  • Dan McCaffrey, RAND
  • Roy Pea, Stanford University
  • Geoffrey Phelps, Educational Testing Service
  • Rob Ramsdell, Cambridge Education
  • Doug Staiger, Dartmouth College
 As "key contributors," the report identifies:
  • Joan Auchter, National Board for Professional Teaching Standards
  • Charlotte Danielson, The Danielson Group
  • Dan Goldhaber, University of Washington
  • Pam Grossman, Stanford University
  • Bridget Hamre, University of Virginia
  • Heather Hill, Harvard University
  • Sabrina Laine, American Institutes for Research
  • Catherine McClellan, Educational Testing Service
  • Denis Newman, Empirical Education
  • Raymond Pecheone, Stanford University
  • Robert Pianta, University of Virginia
  • Morgan Polikoff, University of Southern California
  • Steve Raudenbush, University of Chicago
  • John Winn, National Math and Science Initiative

Sunday, December 12, 2010

Averaging 2006, 2007, and 2008 results, Towson University in Maryland graduated:
  • 67 percent of its white students
  • 67 percent of its African-American students
  • 70 percent of its Hispanic students
That's gold-standard work, well above the national average 55 percent and with no gap between white and black results.  Today's Washington Post explores how Towson makes it happen:
In 10 years, according to school data, Towson has raised black graduation rates by 30 points and closed a 14-point gap between blacks and whites. University leaders credit a few simple strategies: admitting students with good grades from strong public high schools, then tracking each student's progress with a network of mentors, counselors and welcome-to-college classes.
"Regardless of your background, there's people here for you who understand what you're going through," said Kenan Herbert, 23, an African American Towson senior from Brooklyn, N.Y.
Towson's president sounds like my favorite Kentucky superintendents when he takes institutional responsibility for institutional outcomes:
"The goal has been, if you take them in, you should graduate them," said Robert Caret, Towson president since 2003.

Measuring effective teachers: first findings

The Measuring Effective Teachers Project published some initial results Friday.  This giant project involves almost 3,000 teachers in seven urban school districts who volunteered to test themselves, test their students, survey their students, and be observed by video and scored against an array of different evaluation rubrics.  From the first year of work, the project reports four major findings:
First, in every grade and subject we studied, a teacher’s past success in raising student achievement on state tests (that is, his or her value-added) is one of the strongest predictors of his or her ability to do so again.
*     *     *
Second, the teachers with the highest value-added scores on state tests also tend to help students understand math concepts or demonstrate reading comprehension through writing.
*     *     *
Third, the average student knows effective teaching when he or she experiences it.
*     *     *
Fourth, valid feedback need not be limited to test scores alone. By combining different sources of data, it is possible to provide diagnostic, targeted feedback to teachers who are eager to improve.
It's a little disappointing that the first report shares nothing from the video observation part of the project, especially after the method (as opposed to its results) so recently drew national coverage.  Instead, we'll need to wait until:

  • Late spring 2011 for findings from the classroom observations.
  • Late summer 2011 for a proposal on how to weight the various factors in stronger overall evaluations
  • Early 2012 for reports on how participating teachers changed student achievement when working with students assigned to them by random sample. (This first report used data from students assigned to each teacher by their own school’s regular approaches, both during the study and—where possible—during the previous school year.)

Friday, December 10, 2010

Kentucky's higher education puzzle?

How can our spending per student be in the top quarter of states, and our graduation rate in the bottom quarter?  That's what I see in the maps below, created by www.higheredinfo.org with data and details here and here.  There may be good reasons for these results –and there's certainly good reason to encourage public discussion of how both families and taxpayers can get a better return on their higher education investments.


Thursday, December 9, 2010

The beginning of stable standards?

Today's Messenger-Inquirer editorial expresses concern about Kentucky's repeated decisions to replace standards and assessment:
For years, educators repeated that 2014 date over and over again as the time when Kentucky would really be able to see the rewards of its education reform efforts. Only something happened along the way.
Whether it was political maneuvering, the fact it became clear too many schools would not reach that goal, or more likely a little of both, Kentucky decided to scrap the CATS test -- and essentially say the 2014 "finish line" was merely an oasis, and the state needed a fresh start on holding schools accountable.
The legislature voted to devise a new test and a new accountability system, and it's this system that Holliday now wants to use as a replacement for federal adequate yearly progress requirements.
But how long until these "new" standards are thrown out as well? What happens when the political winds shift again, or if the results don't paint the type of picture education officials are expecting?
Parents, educators, business leaders and anyone else who cares about the quality of education needs to have an accountability system that they can trust to actually have some meaning. That doesn't mean that tests and standards can't be tweaked to reflect changes in core content or student demographics.
But it's time to determine what the standards will be, set goals with firm deadlines, and then continue on that path long enough to determine which schools are succeeding, which are broken, and what needs to be done to fix them. Otherwise, we're just left with a bunch of test scores, but no real accountability.
The concern about moving the goal posts is well taken--and a key reason why the Prichard Committee, the Council for Better Education, and the Kentucky Association of School Councils continue to offer Transition Index data that comes as close as possible to sustaining our old accountability system until the new one kicks in.

Still, the future may be better than the past on this issue, because our next system will have two new built-in reasons to stay focused and avoid frequent changes in direction.  First, there is lots of public support for the fact that our new literacy and mathematics standards will be consistent with those used  more than forty other states, making it hard to explain going back to a one-state approach.  Second, by 2015, we expect to share a testing system with many of those other jurisdictions, giving us results we can compare nationwide and lots of cost-savings into the bargain, and that too will be hard to give up.

Both factors will promote a stable system of goals and consequences, allowing the main debate to be about the best ways to ensure that all schools move steadily toward delivering for all students.

An end to AYP?

Once Kentucky adopts a new state accountability system, Commissioner Holliday plans to ask federal permission to use that system in place of the No Child Left Behind rules requiring Adequate Yearly Progress or AYP  for each student demographic groups served in each school.  Brad Hughes of the Kentucky School Boards Association reported earlier this week on how Dr. Hollidays shared the idea with the KSBA Board:
“We want a better measure than AYP,” the commissioner said. “We’re pushing hard to get a comprehensive accountability model that measures not only the proficiency rates, but also closing achievement gaps, tracking every student’s growth, recognizing teachers whose students grow one or two grade levels when they were three grade levels behind to start with. We’ve been calling those folks failures. We need to praise them and tell them what a great job they’re doing in helping grow the children.”
In an interview following his remarks to the KSBA board, Holliday said he’s very optimistic that the AYP waiver can be obtained.
“We think (the Obama administration) is very open to replacing AYP,” he said. “We think Kentucky will be the first state to take that waiver request forward, but we think there will quite a few others. It’s all based on the new common core standards and growth models that could replace AYP.”
Notice how this idea relates to our new, more demanding content standards.   Higher standards almost certainly means that fewer students and fewer schools will measure up in the first few years of our new system.  In seeking the waiver, Kentucky can argue that our new goals will be tougher than the NCLB expectations as well as fairer.

Tuesday, December 7, 2010

ACT hints at scale of Common Core challenge

When we start assessing students against the Common Core Standards, what kind of results will we see?   ACT, Inc., has just offered a set of blunt estimates.  Using results from the states where all students participate in the ACT (including Kentucky), the report projects that in first literacy testing of 11th graders:

  • 38 percent will meet the new standards in reading.
  • 51 percent will meet the new standards in writing.
  • 53 percent will meet the new standards for language.
Since the Common Core calls for added focus on informational text and on literacy skills that work for specific fields of study, the report also offered estimated results for 11th grade results in those subjects, estimating that:
  • 24 percent will meet the standards for literacy in science
  • 41 percent will meet the standards for literacy in social studies.
  • 38 percent will meet the standards for informational text.
  • 37 percent will meet the standards for literature.
Mathematics is exactly as grim, with 11th grade projections that:
  • 34 percent will meet the mathematics standards for number and quantity.*
  • 42 percent will meet the mathematics standards for functions.
  • 37 percent will meet the mathematics standards for statistics and probability.

The rationale for the Common Core has always been that American schools need to aim higher and American students need to achieve at higher levels.  This preliminary study provides a first glimpse of how much work we have ahead.

* The ACT mathematics categories come with short explanations of what's in each subdomain.  Number and quantity includes the real number system, quantities, the complex number system, and vector and matrix quantities.  Functions includes interpreting functions; linear, quadratic, and exponential models; and trigonometric functions.  Statistics and Probability includes interpreting categorical and quantitative data; making inferences and justifying conclusions; conditional probability and the rules of probability; and using probability to make decisions.

Sunday, December 5, 2010

NYTimes spots Gates video effort, omits research purpose

Friday's New York Times describes the video technology being used for the Measuring Effective Teachers initiative funded the Bill & Melinda Gates Foundation.  It's an interesting piece about the efficient use of 360-degree cameras to get a panoramic idea of how everyone in the room is affected by a given day's lesson, and the reporting shared several expert opinions on how the technology might move into direct use of teacher evaluations.

That said, I see the article as focusing on the video than on the bigger project the video will support.  Months back, I blogged about the Foundation's own description of the project, which describes the video cameras as a way to allow multiple observers apply several different respected rubrics for classroom observation.  Live observations on the needed scale would be unduly disruptive of ordinary classroom work, which is why the camera strategy was created.

Along with the varied ratings of the videos, the study is gathering data from student surveys about classroom processes, teacher surveys about working conditions, and teacher tests of content knowledge and content teaching methods.

Next year,  each of those indicators will be correlated with several kinds of data on student growth compared to their achievement this year.

With that huge collection of data, the project will be able to offer answers on a really big question:  How well does  each of the gathered indicators (teacher knowledge, surveys, and the different observation protocols) relate to actually delivering student growth?


The NYT coverage could leave the impression that the main point is finding a way to videotape teachers.  Far from it. The video is mainly a tool for developing richer and more important insight into which measurement tools best identify teaching that changes student performance.

Note: The Prichard Committee and I personally have not been involved in the implementation of this Effective Teachers part of the Gates Foundation's education investments.  However, we are working on several of the Gates Foundation's College-Ready Work initiatives (see information here, here, and here), and I have been included in several briefings on the progress of this measurement effort.

Has the C-J spoken incorrectly on a second factual issue (JCPS novice results)?

In an earlier post today, I explained why I believe the Courier-Journal's editorial this morning incorrectly described Jefferson County's proficiency trends. In this post, I turn to another claim in the same editorial, this time the one that says "students rated novice have dropped sharply."

For that statement as well, I respectfully submit that the editorial has not accurately described the facts.

Far from dropping sharply, the percent of Jefferson students scoring at the novice level increased from 2007 to 2010 at every level in reading, mathematics, science, and social studies and at the elementary level in writing. The only novice results that have a net three-year decline are middle and high school writing, and while the 14.5 percent decline for high schools is a large one, the 0.24 percent shift for middle schools is not a drop to which the modifier "sharp" can reasonably be applied.

The table below shows the full results, highlighting individual years when the percent novice went up in each subject as well as the 2007 to 2010 net increase in novice performance in nearly all subjects:


As I wrote in the earlier post, I will, of course, gladly consider any data the Courier-Journal may have relied on and will update this report if I have overlooked a way to analyze the results which would justify the claim that novices "dropped sharply."  Unless and until I see such an analysis, I respectfully submit that Jefferson County has seen a net increase, not a sharp drop, in students scoring at the novice level in nearly every subject at nearly every level.

Source note: The data reported above came from the Kentucky Department of Education's 2009-10 Interim Performance Report: Jefferson County Public Schools, run date 11/2/2010, available here, with my arithmetic combining the proficient and distinguished percentages shown here

Has the Courier-Journal spoken incorrectly on a point of fact?

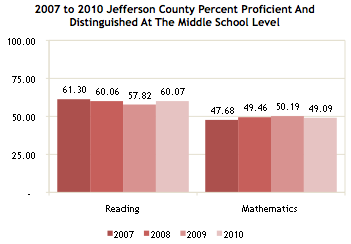
I believe the Courier-Journal included an untrue statement in this morning's "Stop and Think" editorial.  Addressing the Jefferson County School Board's decision not to renew Superintendent Berman's contract, the editorial asserts that "percentages of students testing proficient in basic academic skills have risen steadily."

I respectfully submit that since 2007, proficiency levels in Jefferson County Public Schools have risen steadily only in high school writing.  In every other tested subject at every level, proficiency declined in one or more of the last three years.  Looking at the three-year change, proficiency is flat for elementary reading, and down for mathematics in high school, writing in elementary and middle schools, and science and social studies at all three levels.  The district saw net three-year proficiency gains only in elementary and middle school mathematics and in high school writing. I see no reasonable way to characterize Jefferson County proficiency results as having "risen steadily" in recent years.

Here are the district's elementary level results for reading and mathematics for the last four years:
Reading results went down in 2008 and 2009, with a 2010 return to exactly the 2007 level.  Mathematics results went up in 2008 and down in 2009 and 2010, with a net increase of 1.34 percent compared to 2007. Neither trend could be called rising steadily.

Here are the middle school results, showing reading results going down, down, and up, with a net decline of 1.23 percent from 2007.  Mathematics results went up, up, and down, with a net gain of 1.41 percent compared to 2007. 
At the high school level, reading went up, down, and up, with a net result 0.53 percent lower than 2007.  Mathematics went down, up and down, with a net result 3.26 percent lower than 2010.

Overall results, combining all three levels, show reading results down, down, up, with 2010 results 0.54 percent lower than 2007.  In mathematics, the trend was up, up, and then down, with the 2010 results 0.92 percent higher than 2007.


For science and social studies, 2010 results were lower at every level than in 2007.  For writing, 2010 results were lower at the elementary and middle levels but higher for high school, as shown in the table below.

I will, of course, be delighted to consider any data the Courier-Journal may have relied on and to update this report if I have overlooked a way to analyze the results which would justify the editorial's factual assertion.  Pending seeing such an analysis, I respectfully submit that Jefferson County "percentages of students testing proficient in basic academic skills" have been mostly stagnant or in decline in recent years.

Source note: Nearly all of the data reported above came from the Kentucky Department of Education's 2009-10 Interim Performance Report: Jefferson County Public Schools, run date 11/2/2010, available here, with my arithmetic combining the proficient and distinguished percentages shown here.  The one exception is that the graph combining all three levels uses data from the Kentucky' Department of Education's No Child Left Behind Adequate Yearly Progress Reports for 2007, 2008, 2009, and 2010, available here.

Saturday, December 4, 2010

Graduation progress (counted the federal way)

Using the federal government's Averaged Freshman Graduation Rate (or AFGR) method, Kentucky moved much closer to national average between 2003 and 2008.  Over the same years, only nine states showed greater graduation improvement using that approach to measuring  graduations. The rates themselves look like this:

The AFGR method uses an estimate of the number of students who enter ninth grade in one year and then graduate four years later.  Because many state data systems have been unable to separate first-time ninth-graders from repeaters, the method estimates the first-time count by averaging a year's ninth grade with eight grade from the year before and tenth grade from the year after.   The AFGR reflects the number of graduates in a given year divided by that averaged figure from three years earlier. Thus, the newer rates shown in the graph above come from this set of numbers:

Having shared that data, I'll note that the whole discussion of graduation rates is a troubled and confusing one and will stay that way until our student data system can indeed track a cohort from start of grade 9 to graduation.  Using the Infinite Campus data system, we expect that to be possible for the class of 2013.  

Until then, the AFGR approximation shows  Kentucky much closer to national average two years ago than we were seven years back.

Source note: Data for this post comes from the "Building a Grad Nation" report issued recently by America's Promise, with backup details from National Center for Education Statistics reports on "The Averaged Freshman Graduation Rate for Public High Schools From the Common Core of Data: School Years 2002–03 and 2003-04" and "Public School Graduates and Dropouts From the Common Core of Data: School Year 2007–08 First Look."

Next Accountability?

I've tried at length to develop a summary of the Department of Education's new accountability proposal.  So far, I haven't met my own standards for being both brief and complete, because the model has a lot of moving parts to it.

With a Kentucky Board of Education discussion slated for Tuesday, December 7, I should alert readers that at this link, they can download and do their own analysis with:

  • A white paper offering "Goals and Guiding Principles"
  • A narrative summary of the model for accountability for student results, which includes achievement, gap reductions, growth, college and career readiness, and graduation data.
  • A draft regulation to enact that model.

Kentucky's Next Giant Steps (a fresh edition)

We've had several editions of the PrichBlog one-page summary of Kentucky's big push to raise student standards and results, and it's time for an update that leaves out the earlier discussion of Race to the Top and adds in basics of our learning and testing strategies.  Here's the new version (with an option to download for easy printing here):

FOUR GIANT STEPS FOR KENTUCKY EDUCATION
DECEMBER 2010 OVERVIEW OF KEY DEVELOPMENTS

SENATE BILL 1
Senate Bill 1, passed in 2009, requires Kentucky to upgrade its standards for what students will learn. Our new law says the standards must be shorter, clearer, and better focused on students being ready for college, work, and global competition. To match the new standards, Kentucky will use new tests starting in the spring of 2012. Current teachers will receive specialized training on how to teach the new standards well, and teacher preparation programs will equip future teachers with the same skills.

COMMON CORE STANDARDS SHARED BY MANY STATES
For language arts and mathematics, Kentucky has adopted the new Common Core State Standards. The Common Core offer a grade-by-grade statement of what students will need to be on track for college-and-career-readiness when they finish high school. Because more than forty other states have adopted the Common Core, our expectations will be consistent with goals being used across most of the country, and as strong as learning standards used by the most competitive countries elsewhere in the world. Kentucky is also working with other states on shared science standards that should be available in late 2011, and on social studies standards that may take longer to complete.

ASSESSMENT FOR LEARNING STRATEGIES TO MEET THE STANDARDS
To meet those new college-and-career ready standards, teachers will need increasingly effective approaches to classroom work. One key strategy, called “assessment for learning,” uses classroom activities designed to identify next steps for each student to keep climbing toward the overall goal. When it is done well, assessment for learning makes classroom work more focused and effective, with students seeing each success as a reason to try even harder on the next set of work. Kentucky teachers from each school district are now studying those approaches in regional networks, and collaborating with local administrators to plan ways to share the methods with all their local schools. Teacher preparation programs are putting new emphasis on the same strategies. Research shows that the assessment for learning approach can have a big impact on overall achievement, with the most positive effect on the students who would otherwise be likely to fall behind.

NEW TESTING TO CONFIRM STUDENT SUCCESS ON THE STANDARDS
Kentucky will also use statewide testing to confirm that students are indeed on track to reach the new standards. The states that are using the Common Core Standards are also developing new methods to test and report student progress to parents, teachers, officials, and the general public. Those shared tests are being developed with large new federal grants and will begin in 2014 or 2015. For 2012, 2013, and maybe 2014, Kentucky will use a temporary test that matches the new standards but will not have all the strengths of the longer-term, multi-state testing methods.

Our new standards, classroom strategies, and statewide testing are all part of our Senate Bill 1 effort to deliver stronger results for all Kentucky students and build a stronger future for our entire state.

Back to blogging

I've just finished an amazing week of learning and building, working about 12 hours a day on exciting education projects.  Only, I didn't realize how intense it was going to be in advance, so I apologize for PrichBlog's unannounced silence.  I'll spend today blogging on some important developments.

Saturday, November 27, 2010

A compelling vision grows clearer

In 2000, Bob Sexton authored a great piece on "Engaging Parents and Citizens in School Reform," including this clear point on Prichard Committee strategy:
After the [1990] reform passed, reminding people about the original problem became the challenge. The strategy was to remind people about Kentucky’s historically low educational level and inject into the public bloodstream a compelling new vision —that of all children learning at high levels.
For 2010, I think that strategy still fits well, with three helpful changes in the terrain in which we need to apply it:
  • With the new Common Core standards, "learning at high levels" can be defined much more specifically as "becoming college and career ready."
  • The confidence that students can learn at those high levels can now be based on more complete statements of how can happen, grounded in the "sunlit vision" of assessment for learning practices that move students toward those standards.
  • The confidence that teachers can deliver that high level of learning can now be based on more concrete statements  about how working in teams organized as professional learning communities, educators can help all teachers grow increasingly effective in their chosen craft.
Of course, achieving that vision will require that Kentucky implement the standards, apply the assessment for learning practices, and cultivate those professional learning communities: that's the work immediately ahead of us all.   Still, it's good to see the strategy as still sound and the vision as actually growing stronger after another decade of work.

Source note: Bob's essay appeared in All Children Can Learn, edited by Roger Pankratz and Joseph Petrosko and published by Jossey-Bass.  Paperback and Kindle versions are available here, and most (though not quite all) of Bob's chapter is available on-line here.

Friday, November 26, 2010

Paying for Senate Bill 1 (the hard way)

Some Senate Bill 1 costs will be paid this year by cutting what Kentucky school districts receive for professional development.

SB 1 is the 2009 legislation that called for Kentucky to adopt new, college-and-career-ready standards, assessments to support those standards, and new efforts to prepare teachers to deliver on the standards for all students.  It set an important and positive overall direction for Kentucky education, but it came without added dollars for the added work that will be required.  For a little while, the federal Race to the Top competition also seemed like a way Kentucky might find the resources to implement the bill's mandates, but Kentucky did not win a grant in either the first or the second round of the competition.

According to a "Fast Five on Friday" message sent to superintendents last week, the Department reallocated state-level funds to meet most of the SB 1 costs for this fiscal year, but still found itself "short of approximately $2.6 million necessary to implement all required components."  Holding back the professional development dollars will fund those other components.

It's good to see SB 1 implementation moving forward, but this is a painful way to make it happen!

[Hat tip: KSBA]

Thinking about cost per pupil

Stretching the School Dollar is a 2010 volume that offers a set of recent proposals on "how schools and districts can save money while serving students best." One intriguing idea, from Marguerite Roza, offers a method rather an answer: she suggests analyzing districts, schools, programs, courses, and even individual sports on a per-unit or per-pupil basis. She gives many examples of how that approach helps everyone make comparisons and think more clearly about choices.

It's a convincing argument, and I'm going to try to apply it in blogging.  As a student count, I'll generally use the average daily attendance figure the Department uses for SEEK funding--though I'm open to reader arguments for using a different figure.

State K-12 funding for 2010-11, as budgeted in the spring 2010 special session, works out to per-pupil funding like this:
  • $3,763 for SEEK funding districts can use for overall schooling costs.
  • $2,011 for health insurance, life insurance, and retirement benefits for teachers and other school and district staff.
  • $371 for transportation.
  • $353 for new and renovated facilities.
  • $186 for categorical programs to provide targeted services to K-12 students: textbooks, gifted services, extended school services, family resource centers, and the like.
  • $89 for specialized schools, including the School for the Blind, the School for the Deaf, and vocational schools.
  • $37 for work that supports teaching quality, including district professional development, centers, and other programs and grants.
  • $27 for state assessments and interventions in schools with the weakest results.
  • $13 for the Education Professional Standards Board.
  • $8 for student support programs targeted for use in specific districts and regions.
  • $13 for other programs not listed above.
There's another $103 per pupil in the budget section for the Department of Education that I haven't fully figured out.  There are line items for KDE and technology and then there's an amount that isn't itemized that I'm sure includes costs of both KDE operations and technology and network expenses.


 As noted, that's a downpayment, but it does already give me a sense I didn't have before of how facilities and transportation now dwarf the funding for categorical programs to provide other services.

Feel free to download my state funding calculations and send me questions and improvement ideas, and stay tuned as I work some more on figuring out what can be learned from using this approach regularly.