Friday, November 18, 2016

2016 Trend Snapshots (Part 2)

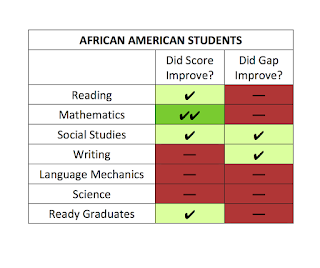
Here are the small tables that summarize changes for Kentucky's African American students, Hispanic students, and students of two or more races. As with the other tables shared yesterday, a dash across a red background indicates results that did not improve from 2015 to 2016.  A check mark on a green background means positive change, and double check marks on darker green show positive change of two or more points. 


 Of the three charts, the one for African American students is the most positive, but the trends are still pretty mixed. Results improved in three subjects in ready graduation, but also went down in three subjects. The gaps compared to white students only improved in two subjects, and the writing gap change is based on both groups losing grounds but white students taking the larger loss.


Students of two or more races also had mixed results, while Hispanic results were pretty steadily troubling: only math showed score improvement and both of the gaps that narrowed shrank because of white declines that were bigger than those for Hispanic students.

More generally, do note that the positive changes leave plenty of work still to be done to serve all students well.

All three tables come from the Prichard Committee's new “2016 Statewide Results: An Excellence with Equity Report.” The press release announcing the report is available here, and the full report can be downloaded here.

Thursday, November 17, 2016

2016 Trend Snapshots (Part 1)

The three small tables below summarize changes for three student groups from 2015 to 2016.  below, a dash across a red background indicates results that did not improve.  A check mark on a green background means positive change, and double check marks on darker green show positive change of two or more points. 


At a glance, thesnapshots  show a good news pattern for students with identified disabilities, mostly good news for students eligible for free or reduced-price meals, and quite troubling news for English learners.  Do note that the positive changes leave plenty of work still to be done to serve all students well.

All three come from the Prichard Committee's new “2016 Statewide Results: An Excellence with Equity Report.” The press release announcing the report is available here, and the full report can be downloaded here.

2016 Statewide Results: An Excellence with Equity Report (New Prichard Report!)

Latest state test scores show modest progress in narrowing achievement gaps for some student groups, but far more challenges remain

LEXINGTON, Ky. – The latest state test results reveal a mixture of good news and troubling challenges about Kentucky’s progress in narrowing achievement gaps among groups of students and delivering educational excellence with equity statewide.

That is the conclusion of the Prichard Committee for Academic Excellence’s recent report to raise awareness of achievement gaps and accelerate community and state efforts to eliminate them.

“2016 Statewide Results: An Excellence with Equity Report” is the first of what will become an annual analysis of the test results recorded by Kentucky’s elementary and secondary students. The study asserts that while no one assessment can give a complete picture of student learning, the results provide an important snapshot of recent progress and the work that lies ahead.

The report, based on information in Kentucky’s 2016 school report cards, reveals the following:

  • Good news for students with identified disabilities, including improvement in math, reading and college/career ready graduates along with narrowing gaps on most indicators.

  • Mostly good news for students eligible for free or reduced-price meals, with growth in math, reading and college/career ready graduates and with all gaps shrinking between those students and their classmates with higher family incomes.
  • 
Mixed news for African American students and students of two or more races, with improvements in math, reading and college/career ready graduates, but many gaps getting wider compared to their white (non-Hispanic) classmates.

  • Troubling news for Hispanic students, with math as the only improving subject and most gaps getting wider compared to their white (non-Hispanic) classmates.

  • Troubling news for English learners, with a pattern of declining scores and widening gaps compared to students who are not English learners.
The report visually displays the results with a series of charts that reflect the status of the achievement gaps in various subjects. 

“Where there is good news here, it is good news about making one worthwhile step in a long journey,” the report states. “We need sustained improvement at a robust pace, year after year, to equip all of Kentucky’s students for successful futures.” The report adds that progress in math is worth celebrating, but much more work must be done. Three examples illustrate this point:
  • For elementary students with identified disabilities, 3.4 percent growth in math proficiency is good news and it still means only 28.2 percent of those children are proficient.

  • For middle school students eligible for free or reduced-price meals, a 4.4- point step up in mathematics is important and it only moves that group to 35.6 percent proficient.

  • For high school African American students, a 4.5-point increase is exciting and not nearly enough when only 27.3 percent of those students have reached proficiency.
The framework for the Prichard Committee’s initiative on achievement gaps is provided in Excellence with Equity: It’s Everybody’s Business.

“We are making headway, but not enough. This year’s results underscore the need for Kentucky to make faster progress, particularly for students starting out farthest behind. Education is the key to future opportunity for our young people and our state. To increase student outcomes, we need communities to come together in support of our schools and each student’s success. With urgency and focus, we will rise to the challenge. Kentucky has done it before, and we can do it again,” said Brigitte Blom Ramsey, executive director of the Prichard Committee.

The full report is available for download here.

Saturday, November 12, 2016

Accountability Changes: Six Big Questions

| Susan Perkins Weston |

Kentucky is building a new accountability system. The federal Every Student Succeeds Act (ESSA) gives us more options than No Child Left Behind offered, and that’s one reason for the change. The bigger reason for change is to identify where we want to take our own children, how we’ll check and report our progress, and how we’ll respond if that progress gets off track. Six questions look to me like the minimum topics Kentucky must address in a new system. Here, I’ll explain those questions and share a few notes on each.

1. What should our rising generation know and be able to do?
Kentucky law sets our overarching goals, and the Kentucky Academic Standards add detail, including expectations for each grade or level.

ESSA requires Kentucky to set “challenging State academic standards” that are “aligned with entrance requirements for credit-bearing coursework in the system of public higher education [and] State career and technical education standards.” Keeping current standards, modifying them, or starting over will all be options.

So far, I haven’t heard much talk of major standards changes, but there is discussion of reviewing math and language arts after six years of use, and social studies may also be ready for some fresh thought.

2. What indicators can we use to track our progress toward those desired results?
Our current accountability rules use assessment data to indicate how students perform each year in six subjects and their year-to-year growth in reading and math. They also consider graduation rates and program reviews.

Under ESSA, Kentucky needs five kinds of indicators:
  • Achievement, shown by proficiency on assessments
  • Growth or another “statewide academic indicator”
  • Graduation rates
  • English language proficiency for English learners.
  • At least one additional indicator of “school quality or student success.” 
English language proficiency does not have to be broken out (disaggregated) by student groups, but disaggregation is required for all the other indicators we use.

Kentucky is completing a major discussion of elements to include in a school’s “dashboard “ of data. Next steps may include specifying which assessments Kentucky will use and whether Kentucky will choose the growth or the “other academic” option. There is interest in using attendance or chronic absences as a “school quality or student success” measure, and other data may also be included there.

3. How far and how fast do we intend to raise those indicators?
In years past, Kentucky aimed for proficiency in seven subjects by 2012 (and later by 2014). Our current system asks schools to move Next Generation Learner scores up half a point or a point a year—setting a somewhat slower improvement pace.

ESSA calls for “ambitious State-designed long-term goals, which shall include measurements of interim progress.” ESSA also calls for subgroup goals calling for underserved groups to “make significant progress in closing statewide proficiency and graduation rate gaps.”

At the Prichard Committee’s Annual Meeting, Kati Haycock of the Education Trust urged the participants to pay close attention to these choices. The long-term goals and interim measurements are where Kentucky can show our sense of urgency about our students’ futures.

4. How will we differentiate schools each year?
Our indicators will be used to report annually on how each school is doing. Recently, Kentucky has differentiated schools by calling them distinguished, proficient, or needs improvement. Our next system could use those terms, other words, letter grades, or another approach. A system of star ratings appears to be the leading idea.

ESSA also says the process must “include differentiation of any such school in which any subgroup of students is consistently underperforming.” The term “underperforming” seems to include all gaps rather than just the larger ones. Deciding how the differentiation method can make those student group issues highly visible will be an important challenge

5. How will we identify schools for added support?
Kentucky’s currently identifies priority schools and focus schools. ESSA lets us move to identifying schools for:

  • Targeted support and improvement if they have the underperforming subgroups mentioned in the differentiation discussion.
  • Additional targeted support if a student subgroup performs like the bottom 5% of schools.
  • Comprehensive support and improvement if they are in the bottom 5% of schools or if one-third of students don’t graduate (high school only) or if schools are in additional targeted support for too many years (with the state defining too many).

Can Kentucky identify the bottom 5% of schools (and groups scoring like the bottom 5%) without combining all indicators in a single number? So far I have not seen a mathematical way to do that, but one good demonstration could quickly convince me.

6. What support will we provide to identified schools?
How can we change results at schools that have not moved students forward in the ways the state calls for? Kentucky has tried consequences, and we’ve tried intervention, and ESSA calls for Kentucky to identify its own best plan for support and improvement work.

For this challenge, I hope Kentucky can choose a short list of key elements a school should work on, allowing the folks at the school do deep, sustained work on that short list.

Source note: The ESSA requirements listed here are set in Section 1111 of the new federal legislation.
Friday, November 11, 2016

Career Readiness at a Crossroads

On November 10, the Prichard Committee and the Kentucky Chamber of Commerce co-hosted an informational webinar with Kate Blosveren Kreamer, Deputy Executive Director at AdvanceCTE, to discuss approaches to integrating measures of career readiness into school accountability and performance reports.

Kentucky has been a trailblazer in incentivizing college and career readiness through its accountability system. Today, Kentuckians are working together to design a new accountability system for schools and districts.

This is a moment for the state to build on what we have learned, to set ambitious goals and define indicators that send clear signals to schools and communities about the preparation students need to succeed in postsecondary education and careers.

It is important for business, education, and community leaders, as well as parents and students, to be informed and engaged through this process. 


The webinar included discussion about a few key questions from participants.
What needs to be in place to make sure that students have the encouragement and support to follow a rigorous, meaningful pathway of their choosing?

What questions should local business, community, and postsecondary education leaders ask at the local level to find out how students are being supported in career pathways?

How can the accountability measures be designed to ensure equitable opportunities for students regardless of background?

My three big takeaways from the webinar are that 1) college readiness can be seen as a foundation, with employability and technical skills for career readiness building on this academic foundation and 2) multiple career readiness measures are needed that reflect achievement, attainment, experiential learning, and postsecondary success and 3) that within each of these areas, there is a range of measures from those that better reflect where a state is today to those that reflect higher aspirations, or stretch, for where the state wants to be in the near future. 


Here are some resources to learn more about this topic: