Saturday, December 30, 2017

Districts’ Other Revenue Grew, But May Not Be A Gain

| Post by Susan Perkins Weston |

Yesterday’s post discussed changes in district revenue per pupil from 2008 to 2016, looking at local, state, and federal funding, including the district on-behalf payments. It left out the Other Revenue listed in Revenue and Expenditure Reports. This post explains why that Other Revenue may not show school districts’ gaining any financial ground.

KDE's Chart of Accounts Quick Reference Guide shows that:

  • Bond Issuance is a big part of Other Revenue. When a district sells bonds, the buyer expects the purchase price back with interest. It’s quite a lot like taking out a mortgage: you get dollars now, but you also get a matching obligation to pay back all those dollars, and more, within a matter of years.
  • Sale or Compensation for Loss of Fixed Assets is another major part of Other Revenue. In a sale, the district gives up something (a bus, a copier, an obsolete building) for the dollars it receives. When a district is compensated for a loss of that kind of asset, that again means something has been given up. In either case, the district might gain, lose, or break even, but to tell, we’d have to compare the dollars received to the value of the items—and the Revenue and Expenditure reports don’t tell us the item’s value.
  • Other Revenue also includes some additional categories without a major heading, including loan proceeds, capital lease proceeds, other items, capital contributions, amortization of premium, special items and extraordinary items. Loans sure sound like they need repayment, and capital leases sure sound like the district has to let the renter use some district buildings or equipment. There’s room for more research on these, but the terms themselves show that the amount paid in may not really add to the district’s bottom line revenue.

In short, the common factor in Other Revenue seems to be that the district gives up something to get something else, and the problem is that we can’t tell if the end result is a gain or a loss.

So, in the chart below:
  • Yes, Other Revenue was reported as higher by $640 after adjusting for inflation, and
  • Yes, Total Revenue including that Other Revenue was higher by $446 after adjusting for inflation, but
  • No, that does not tell us that districts had $440 more to spend on serving students

Details for Number Lovers:


Source Notes: The sources for this post are the same as for yesterday's revenue post.


Friday, December 29, 2017

Since 2008, Districts' State Revenue Losses Have Been Bigger Than Local & Federal Gains

| Post by Susan Perkins Weston |
From 2008 to 2016, looking at average inflation-adjusted per pupil dollars, Kentucky’s districts saw:
  • A $168 increase in local revenue
  • A $68 increase in federal revenue
  • An $820 decline in state revenue sent to the school districts
  • A $389 increase in state payments on behalf of school districts
  • A $194 decline when those four sources are combined
Those rising on behalf payments include state payments for school employees’ health insurance and for teachers’ retirement, along with some other items. In 2008 reports, reported total district revenues did not include those payments, so the amounts above reflect the on-behalf totals from a separate page of the same spreadsheet file.

Still, it should be clear that when you add the two parts of the state funding together, the totals are down since 2008, and down by more than the increase in local and federal money flowing in.

The relevant state reports also list some "other revenue." An upcoming post will explain why those dollars may not reflect added district ability to meet student needs, so stay tuned.

Details for Number Lovers:


Source Notes:
FY 2008 local, federal, and state (excluding on behalf) revenue totals are from the Receipts tab of “Receipts and Expenditures 2007 2008” spreadsheet, downloaded from education.ky.gov.

FY 2008 state on behalf revenue total is from the On Behalf tab of the same spreadsheet of “Receipts and Expenditures 2007 2008” spreadsheet.

Inflation-adjusted 2008 revenue totals reflect a 12.61% increase to show change in the Consumer Price Index from December 2007 to December 2015 (using December as the midpoint of each fiscal year and inflation rates from the BLS CPI calculator).

FY 2016 local, federal, state, and state revenue totals are from the 2016 AFR Revenue tab of “Revenues and Expenditures 2015-2016 ” spreadsheet, also downloaded from education.ky.gov

Per pupil amounts reflect the total revenue dollars, divided by 585,496 pupils in average daily attendance in FY 2008 or 618,455 pupils in average daily attendance in FY 2016, taken from the spreadsheets listed above.

Thursday, December 21, 2017

Two new ways to see learning | Better tests, better learning

| Post by Cory Curl |

Note: We're taking time to explore what families and communities might want to know about what's new and what's around the corner for student tests in Kentucky, organized around five major purposes. With this post, we're focusing on the second purpose: providing information to help teachers understand and guide student learning.

  • Learning
  • Informing
  • Clarifying
  • Benchmarking
  • Measuring

  • As a parent, I'm always curious about how learning happens in my child's classroom, and appreciate parent and community leaders who express curiosity about how learning happens in all classrooms.

    One area that I've enjoyed learning more about in the last few years is formative assessment. There are many different definitions out there. To me, formative assessment is a process teachers use to see what students know and can do, and then, based on what they see, make decisions about their next teaching steps.

    Image of Mars Curiosity rover downloaded from NASA


    Formative assessment informs the learning process. Our last post was about ways to get information out of students' brains to strengthen students' learning. This is about ways to get information out of students' brains to strengthen teacher understanding about what a student (or group of students) knows or does not yet know, or even misconceptions that need to be addressed. Teachers can then better make decisions about whether an individual student (or group) grasped the lesson and is ready to move on, or needs extra practice, help clearing up a misconception, or more intense support to master the concept.

    As in our last post, this is about testing with little or no "stakes" such as grades or scores for students.

    Conversations with Kentucky teachers have introduced me to two new ways formative assessment is being used in mathematics classrooms:

    1. Exit tickets
    An exit ticket is a question or short series of questions that students answer after a lesson or at the end of the day to give teachers an immediate grasp on what students have learned and where they might be struggling. Teachers then use the information they glean from exit tickets to decide what support individual students, groups, or the class as a whole needs on a particular concept.

    2. Formative Assessment Lessons
    The Kentucky Department of Education has designed Formative Assessment Lessons (FAL's) in mathematics for elementary grades. Students complete a pre-assessment prior to the lesson, the teacher shares the lesson, and then students work in small groups to complete a task. Teachers then analyze student responses to the task. Based on their responses, they provide immediate feedback to students in the form of questions or thinking prompts. They can also group student responses into categories to determine what group of students have mastered certain concepts, have misconceptions, or need more intense support. They can also look at the responses as a whole to decide how to go through the rest of the learning unit. This story from Kentucky Teacher shares how teachers use FAL's at Kirksville Elementary in Madison County.

    Here are a few more resources about formative assessment:
  • National Council of Teachers of Mathematics Five Key Strategies for Effective Formative Assessment from Dylan Wiliam
  • What is the Exit Ticket? from Eureka Math
  • Teacher guidance on using exit tickets on teacher/coach/author Doug Lemov's Field Notes blog

  • Next time, we will discuss how tests can be used to clarify learning expectations for teachers, parents, and students.

    Tuesday, December 19, 2017

    Just a moment for learning | Better tests, better learning

    | Post by Cory Curl |

    Note: We're taking time this week to explore what families and communities might want to know about what's new and what's around the corner for student tests in Kentucky, organized around five major purposes. Today, we're focusing on the first and most important: student learning.

  • Learning
  • Informing
  • Clarifying
  • Benchmarking
  • Measuring

  • Many tests have stakes attached -- a grade, a license, a scholarship spot -- and these stakes make us nervous. This post is not about these tests: it's about tests with little or no stakes at all. This might not even fit your definition of a test! That's fine!

    This post is about tests that are just between us and our brains. They create learning.

    I'm wary of adding to your list of edu-jargon words, but this might be a new one for many of you: retrieval. We too often think of learning as getting information into our brains, but it turns out that long-term learning, knowledge, and understanding emerge from getting information out of our brains. And when information lays quiet in our brains too long without being retrieved, it fades away. The Pixar film, Inside Out, depicted this process vibrantly.

    Image downloaded from Pixar


    This means that done well, short tests or quizzes can be an important strategy for learning. As well, prompts for students to quickly reflect on or summarize what they've learned, flashcards, problem sets, and other similar methods of "retrieval practice" have been shown to be effective learning strategies. Stakes are not necessary, but effort -- and sometimes struggle -- are. Learning is the reward!

    I've benefited from my own learning about retrieval practice in three ways:

    First, as the parent of a first-grade student who brings home graded and non-graded quizzes, work that includes reflection prompts, and sets to make flashcards, I can better understand how these strategies are supporting his long-term learning and incorporate them into our learning time at home (including the occasional spelling "cwis").

    Second, as a professional who attends quite a lot of meetings, I now take just a moment or two after each meeting to free-write key takeaways and action steps (without looking at my notes). This practice has helped me make deeper connections among the various areas of work that we do.

    Finally, as a graduate school student taking challenging courses with a brain that's on its fifth decade of operation, I know that listening, taking notes, and even understanding a concept during class does not mean that I've learned a thing. I test myself on important concepts ("What are the two assumptions that need to be met for this research method?") after doing pre-class readings, after class, and then at various points in time afterward. These are concepts I need to learn and do not want to fade away.

    To learn more about retrieval and other learning strategies:
  • Books and guides on Retrieval Practice
  • The Science of Learning from Deans for Impact
  • "Students should be tested more, not less" by teacher/author Jessica Lahey, The Atlantic

  • Next time, we will move out from student and the student's brain, to how tests can inform decisions that educators and parents make to benefit students.

    Better tests, better learning

    | Post by Cory Curl |

    Prichard Committee members have long taken great interest in tracking the Commonwealth's educational progress on key measures, including the National Assessment for Educational Progress (NAEP), or "The Nation's Report Card". NAEP provides results in reading and mathematics for 4th and 8th grade students at the national and state levels (as well as for large cities such as Louisville) every two years. (It also provides less frequent information on a variety of other subjects such as science, civics, and the arts.)

    We were expecting a new round of NAEP reading and mathematics results this fall, but the public release has been postponed until March or April. It turns out that in 2017, for the first time, most students took a digital version of the NAEP test on tablets instead of a paper version with the traditional #2 pencil.

    According to the National Assessment Governing Board (NAGB), the agency that oversees the test, "the digital environment allows for innovative ways to tap students’ knowledge and skills. For instance, a reading passage is presented with vivid illustrations and a means to refer back to the text when answering questions. On the mathematics assessment, a calculator embedded on the screen appears when requested by the student and is hidden when not needed to avoid unnecessary distraction when working on items that may require calculator use."

    Given this digital transition, NAGB is taking more time to analyze the results to make sure they can still be compared to past years to track progress.

    This transition also has us thinking about what's ahead for tests in Kentucky classrooms.

    As schools slide into winter break this week, we'll explore what's new and what's around the corner for students, their families and communities, according to five major purposes:

  • Learning
  • Informing
  • Clarifying
  • Benchmarking
  • Measuring


  • Please join us!

    Tuesday, December 12, 2017

    Supporting The Youngest Kentuckians: The Early Childhood Development Fund

    Kentucky’s Early Childhood Development Fund uses 25% of Kentucky’s annual revenue from the 1998 Tobacco Master Settlement Agreement to support the full development of our youngest children. Here’s how the 2017-18 funding is being put to use under the budget adopted in 2016:

    • $9,000,000 for the Health Access Nurturing Development Services (HANDS)
    • $8,894,700 for the Early Childhood Development Program
    • $2,050,000 for the Early Childhood Advisory Council
    • $1,100,000 for Early Childhood Scholarships
    • $1,000,000 for the Healthy Start initiatives
    • $1,000,000 for Early Childhood Mental Health
    • $1,471,400 for several smaller programs

    That’s a total of $24,516,100 working to strengthen very young Kentuckians, and here’s a further explanation of those important activities.

    HEALTH ACCESS NURTURING DEVELOPMENT SERVICES (HANDS): $9,000,000
    The HANDS program provides voluntary home visits to support new and expectant parents’ efforts to help their children grow and learn. All first-time parents are eligible for a first meeting to discuss questions and share resources. Parents who are facing multiple challenges can receive regular home visits that share information, link families to health and other services, and build on the strengths of each family. HANDS is short for Health Access Nurturing Development Services. 10,697 children and their families received HANDS support in 2015-16. Starting in 2016, HANDS support is available to families even if it is not their first child.

    EARLY CHILDHOOD DEVELOPMENT PROGRAM: $8,894,700
    This line item funds two main efforts:

    • First, the Child Care Assistance Program (CCAP) helps low-income working families afford quality childcare for their children, with the help being offered on a sliding fee basis for eligible parents and guardians. The Tobacco Master Settlement provides a portion of the funding for CCAP, with other dollars coming from the state General Fund and from the federal government.
    • Second, child advocacy centers provide comprehensive examinations for children who have been sexually abused in clinics across the state that have been designed to make them feel safe and reduce the trauma of the victimization and examination.

    EARLY CHILDHOOD ADVISORY COUNCIL: $2,050,000
    This line item supports state and local work to develop and coordinate quality early childhood development. At the state level, the Early Childhood Advisory Council oversees standards and goals for Kentucky’s early childhood system and advocates for quality early childhood services and improved school readiness. Members are appointed by the Governor to represent a broad range of early childhood educators, administrators, and advocates, and the Advisory Council’s work is s supported by the Governor’s Office of Early Childhood. At the local level, Community Early Childhood Councils (also known as CECCs) promote high quality early childcare and education by working to identify and address local needs, building up capacity in particular counties or groups of counties. 74 CCECs have received funding for 2017-18.

    EARLY CHILDHOOD SCHOLARSHIPS: $1,100,000
    These scholarships strengthen the quality of early care programs and education. For those who work in early care and education programs or as preschool classroom assistants, scholarship dollars support work toward a child care development associate credential, an associate’s degree in early childhood education, a bachelor’s degree in interdisciplinary early childhood education or an approved related program, or early childhood development Director’s certificate. 1,374 scholarships were awarded in 2016-16.

    HEALTHY START INITIATIVES: $1,000,000
    Healthy Start in Child Care provides free technical assistance to child care providers, promoting safe, healthy, and nurturing environments for children’s development. Nurses and health educators serve as Healthy Start consultants based in local health departments, and provide support by phone, e-mail, and on-site work.

    EARLY CHILDHOOD MENTAL HEALTH: $1,000,000
    Regional early childhood mental health specialists help their regions better serve young children with social, emotional and behavioral issues. Their work includes providing evaluation, assessment, and therapeutic services for young children and their families, along with training and consultation to strengthen programs that serve those children. The program supports a specialist for each of Kentucky’s 14 community mental health center regions.

    SMALLER PROGRAMS: $1,147,100
    Tobacco Settlement resources also provide:

    • $891,400 to help pregnant women recover from substance use disorders
    • $500,000 for early childhood oral health efforts
    • $80,000 for the folic acid program

    Monday, December 11, 2017

    Excellence with Equity in the Early Years

    | Post by Cory Curl | 

    Last week, the Kentucky Department of Education (KDE) released information about the readiness of incoming kindergarten students in the fall of 2017* – the children who will graduate from high school in 2030. The data include results for students overall, but also by gender, race/ethnicity, eligibility for free or reduced lunch, learning differences, and English language learners.

    The data make clear what Kentucky has recognized for decades:

    1. We need to do all we can in the earliest years to make sure children are ready for kindergarten by supporting families in creating safe, nurturing environments at home and by providing high-quality early learning experiences.

    2. We need to make sure children have early elementary learning environments that meet them where they are and help them achieve at their highest potential, addressing their specialized needs and engaging them in challenging, active, and meaningful work.
    From our perspective as equity-minded education advocates, we can look at the statewide results to get a better sense of where schools will need to target resources in the early elementary grades to help each student master reading and mathematics (and well beyond, including social-emotional learning) by the end of the third grade.

    For that, let’s look back at statewide results** for last year’s kindergarteners, the mighty Class of 2029.

    Overall, four student groups have readiness rates (a composite of academic/cognitive, language development, and physical development domains assessed by teachers) below 40%: students eligible for free or reduced lunch, students with disabilities with an IEP, Hispanic students, and English learner students.

    Key findings digging into these domain data (reported as “below average”, “average”, and “above average”):

    • Across all groups, the academic/cognitive domain has the lowest results, with 63% of all students starting kindergarten in the “below average” range. The lowest results here are among the same four groups as in the composite rate.

    • The greatest variation in results is in the language development domain, which ranges from 23% “below average” for female children to 77% for English learner children.

    • Across all domains, African-American children fare higher – in other words, they have lower “below average” rates – than children eligible for free or reduced lunch, students with disabilities with an IEP, Hispanic students, and English learner students. 
    The screener also provides information from parent surveys about children’s social-emotional development and self-help. While the overall results for the social-emotional domain are relatively high – 27% of incoming students have “below average” results – they vary from 17% for female children to 43% for children with disabilities with an IEP.

    All of these results are important for individual children, their families, and their teachers. The patterns and trends we see in them can also point to where schools are more likely to need to allocate additional support for students – clearly, based on these results, to students with low family incomes (more than 64% of the class of 2029), those with learning differences, Hispanic students, and students learning English. 


    This equity data journey would not, however, be complete without walking through the school from the kindergarten to the third grade classrooms. Step inside.

    What do we learn? Quite a bit.

    In 2016-17, across Kentucky’s third grade classrooms:

    • African-American students had lower reading proficiency rates (33%) than students with low family incomes (47%), students with learning differences with IEP (39%), and Hispanic students (43%).

    • African-American students had lower mathematics proficiency rates (30%) than students with low family incomes (42%), students with learning differences with IEP (31%), Hispanic students (41%), and English learner students (31%).
    Kentucky has set ambitious goals to increase reading and mathematics proficiency and close the disparities that have denied equity of opportunity for far too long. While every moment of every day of every grade matters, early childhood and the early elementary grades are an essential part of the equation.

    Notes:


    * This readiness information comes from the state’s Common Kindergarten Entry Screener (the BRIGANCE Early Childhood Kindergarten Screen III). I encourage you to check out the recent results, but also keep in mind that 4,500 fewer students were tested this year than in previous years due to the change in the kindergarten enrollment age cut off from October 1st to August 1st. The absence of these younger students in the overall data makes it difficult to compare trends.

    **Thanks to KDE for giving rich detail by school, by domain and by student group in the School Report Card – just click on state, the assessment tab, and then K-SCREEN. You can also go to “Data Sets” at the top and download an excel file. This is the most recent year where we have detailed results available to the public.

    Wednesday, December 6, 2017

    Needs-Based Aid Has Not Kept Pace with Rising Higher Education Costs

    | Post by Perry Papka | 

     Over the last decade, Kentucky’s investment in need-based financial aid has not come close to keeping up with public tuition or with the cost of living.

    From 2008 to 2018, Kentucky saw:
    • A 2% increase in funding for the College Access Program (CAP), from $60.5 million to $61.9 million
    • A 4% increase in funding for Kentucky Tuition Grants (KTG), from $32.5 million to $33.7 million
    • An 18% increase in the Consumer Price Index
    • A 41% increase in tuition at Kentucky Community and Technical Colleges, the state’s 2-year institutions
    • A 58% increase in tuition at Kentucky’s four-year regional, comprehensive institutions
    • A 64% increase in tuition at Kentucky’s four-year research institutions

    How many students would have used needs-based aid if it had been available? For 2017, the Kentucky Higher Education Assistance Authority estimated that:
    • 28,058 more Kentucky students likely would have used CAP grants if funding had been available
    • 3,777 more Kentucky students likely would have use KTG awards if funding had been available
    • $43.3 million in added funding would have been required to meet likely CAP need
    • $10.1 million in added funding would have been required to meet likely KTG need

    For 2018, CAP and KTG are slated to receive just 40% of projected lottery revenue. State statutes call for the two programs to receive 55% of lottery dollars, but the General Assembly has regularly used budget bills to change how the money is used. Allocating the full 55% could have made another $37 million for these two needs-based programs this year. Lottery revenue grew 29% and $55 million from 2008 to 2018.

    Kentucky needs to better link investment decisions about tuition, state financial aid, and support to colleges and universities. Growing needs-based aid so little while costs grow so much poses a major risk to Kentucky’s ability to equip the next generation to contribute to our economy and our civic life.

    Source Notes: The Consumer Price Index increase comes from using this calculator to convert dollars from July 2007 (start of the 2008 fiscal year) to equivalent current buying power, and the Work Ready funding figure comes from HB 303, the state budget bill adopted in 2016. Tuition figures reflect analysis of public tuition data from the Council on Postsecondary Education. Financial aid figures reflect analysis of data provided by the Kentucky Higher Education Assistance Authority.

    Tuesday, December 5, 2017

    Kentucky Public High School Graduates and Public Postsecondary Completion

    | Post by Perry Papka |

    Kentucky has set an ambitious goal of 60% postsecondary attainment by 2030.

    Here’s a first look at of how Kentucky public high school graduates fare in Kentucky public postsecondary institutions, shown as results for 100 students, using data for the high school class of 2010. Credentials include certificates, diplomas, associate degrees, and bachelor degrees. Some Kentucky high school graduates. This analysis does not include students who enroll more than a year after finishing high school, and it does not include those who enroll at independent Kentucky institutions or out-of-state schools.

    This initial look at pipeline outcomes demonstrates that Kentucky will need bold strategies, steady implementation, and strong investments to meet our statewide attainment goal. The results for students of different backgrounds offer an added emphasis: Kentucky’s progress will require enduring commitment to excellence with equity.


    Persistence and earned credentials are shown as a range of numbers to take into account students who may have enrolled in both a two-year and a four-year institution within a year of high school graduation. The lower number shown above eliminates all possible double-counts, while the higher one includes all possible double-counts.

    Data for the charts above came from Kentucky Center for Education and Workforce Statistics (kcews.ky.gov). KCEWS also offers district-level data on college-going, early success, and completion through its new interactive high school feedback report.

    Monday, December 4, 2017

    Postsecondary Costs Have Shifted Sharply Toward Students, Families

    Postsecondary degrees and credentials strengthen individuals and our state as a whole. That is, they have both private and public value.

    In 2006, Kentucky’s investment to build that public strength covered 66% of the costs of public postsecondary education. Today, that investment is smaller and covering barely more than half of the cost. Meanwhile, the portion paid by individual students and their families has grown dramatically, increasing by nearly more than $3,000 and 88%. Here's a chart showing the scale of the change:

    For many students, this kind of rapidly rising costs may put higher education out of reach. For the state as a whole, this pattern risks another generation underprepared for economic and civic participation.

    Source Note: Amounts above are calculated from the “SHEF Unadjusted Nominal Data” file downloaded from www.sheeo.org, using figures that exclude medical students and medical costs. The chart below provides a more detailed look at the yearly numbers and changes, including the odd-numbered years not shown in the chart above.

    Wednesday, November 29, 2017

    K-12 targeted initiatives have lost key funding

    In 2008, Kentucky’s state budget supported a thoughtful set of targeted programs that served students directly or equipped teachers to serve students more effectively. By 2018, almost all of those programs have been cut or removed from the budget entirely.

    More than $28 million has been taken from programs that had 2008 funding of $1 million or more:
    • -$6.6 million from Read to Achieve grants
    • -$6.3 million from Extended School Services
    • -$5.0 million from Instructional Resources (Textbooks)
    • -$3.2 million from the Professional Growth Fund
    • -$3.1 million from Professional Development
    • -$1.5 million from the Mathematics Achievement Fund
    • -$0.9 million from the State Agency Children program
    • -$0.5 million from the Teacher Recruitment and Retention program
    • -$0.5 million from the Gifted and Talented program
    • -$0.2 million from Teacher Academies
    • -$0.2 million from the Collaborative Center for Literacy Development
    • -$0.1 million from the Commonwealth School Improvement Fund
    Three programs with 2008 funding of $1 million or more have held steady or grown slightly, with:
    • No change to funding for the Safe Schools program
    • $0.2 million added for salary supplements for Nationally Board Certified Teachers
    • $0.3 million added for Family Resource and Youth Services Centers
    Taken together, the many reductions and the few increases net out at more than $27 million of reductions in state support for learning strategies and for teaching quality.

    In addition, programs funded for $33.5 million are no longer shown as budget line items at all. The vanished items included:
    • -$19.5 million from the Kentucky Education Technology (KETS)
    • -$8.4 million from the Commonwealth Accountability Testing System (CATS)
    • -$5.6 million from Highly Skilled Educators
    It seems likely that the Department continues to spend some dollars on those needs, drawing from the parts of its appropriation that are not controlled by specific line items. For example, the technology part of the Department website reports that “KDE provides a yearly funding stream based on Adjusted Average Daily Attendance (AADA) as reported on the Superintendent's Annual Attendance Report (SAAR).” Whatever the Department is allocating, concerned citizens cannot readily see what those amounts are, whether they are increasing or decreasing, or whether they meet or fall short of the learning needs.

    Overall, these targeted investments, meant to sustain statewide strategies for building excellence with equity,  are substantially weaker in 2018 than they were a decade ago.

    Tuesday, November 28, 2017

    Readiness investments have been mixed, inconsistent

    Since 2009, Kentucky has talked a good game about wanting all students to graduate from high school ready for college, career, or both. Our state budget reveals a mixed record on backing up those talking points with needed resources.

    On the one hand, Kentucky has added funding for two kinds of college-level work:
    • $10 million for dual credit scholarships: The 2016 budget created dual credit scholarships for high school students to take one or two college-level courses. Those dollars could allow almost 31,000 students could take two three-hour courses apiece at participating KCTCS schools, public universities, and independent institutions. If Kentucky sustains that commitment, it can make a big difference in student opportunity to understand higher education and show their readiness to succeed at that level.
    • $1.2 million for Advanced Placement incentives: Since 2015, Kentucky has also contributed state resources to AdvanceKentucky, which supports high schools in the initial years of a major push to expand participation in Advanced Placement courses and assessments. Like the dual credit scholarships, AdvanceKentucky gives students a chance to take on college-level work and show their capacity to succeed at that level. At its best, AdvanceKentucky changes the school culture so that AP investments continue long after the program’s startup funding ends.
    On the other hand, our state budgets have reduced and hidden other relevant funding, and we've never funded or fully implemented an important 2008 commitment:
    • A 3% cut to state operated vocational schools: Kentucky has cut $700,000 from its funding for Area Technical Centers since 2008, weakening career-preparation opportunities for students in the very years when career readiness was announced as a state priority.
    • Hidden and optional funding for local vocational schools: For many years, the state budget bill included a line item for funding the technical centers operated by local school districts. That line item disappeared in the 2014 budget bill. So far, the Department of Education has continued to send dollars to districts for this work, and the annual totals have been just under $12 million, in keeping with the past budget lines. For legal purposes, though, the money could stop at any time, or it could be reduced to fund other priorities. For citizens, the spending is no longer visible in the budget and only discoverable by downloading “state grant allocation” spreadsheets from the Department’s website.  
    • A 12% cut for college admissions testing: Since 2008, Kentucky has cut $200,000 from its line item funding for admissions testing. 2017’s Senate Bill 1 amended the law so that it requires a college admissions test but no longer specifies the ACT. The Department of Education continues to fund the test as part of statewide accountability assessments, but the funding must be coming from some other reduction in education services.
    • Never-Funded AP and IB Fees: Since 2008, KRS 160.348 has specified that public school students who take Advanced Placement or International Baccalaureate courses “shall have the cost of the examinations paid by the Kentucky Department of Education,” but that does not happen. Citing a lack of legislative appropriation of those costs, the Department instead directs districts to waive those fees for students eligible for free or reduced price meals. While the Department was able to locate funds to reimburse those costs for the free/reduced meal students for 2017, it has not announced a commitment to do the same for 2018. For students who do not meet the F/R meal requirements, there appears to be no state assistance available.

    Kentucky has a bold vision of transforming high schools so that every student has an accessible on-ramp to further study and/or career skills. We need to back up that vision with clear and consistent investments to make that access a reality.

    Monday, November 27, 2017

    SEEK has become less adequate, less equitable

    The SEEK formula (explained in yesterday's post) is designed to be Kentucky's main approach to providing both adequate funding and equitable funding, but its most important features have been losing strength over time. Here are four major concerns: 

    1. THE BASE GUARANTEE HAS NOT KEPT UP WITH THE COST OF LIVING
    From 2012 to 2017, the guarantee rose by $100 per pupil, from $3,881 to $3,981. To keep up with inflation, the guarantee would have needed to increase by another $171, to $4,152. 

    2. THE BASE GUARANTEE RELIES MORE AND MORE ON LOCAL CONTRIBUTIONS
    The 2012 to 1017 $100 increase was paid for by a $147 per pupil increase in local funding and a $47 decrease in state funding per pupil. The local share went up because property assessments grew by an average of $49,000 per pupil, and the local share is based on the 30¢ per $100 of taxable property. 

    3. TRANSPORTATION ADD-ON FUNDING IS FAR BELOW THE STATE’S OWN ESTIMATE OF TRANSPORTATION COSTS
    By law, the SEEK formula should fund full transportation costs calculated using a statewide formula. For 2017, the formula called for transportation funding of nearly $353 million, but the state budget provided only $214.8 million. That failure to fully fund the formula meant that districts have received an average of $230 less per pupil than legally required. 

    4. LOCAL TIER 2 REVENUE IS AN INCREASING (AND INCREASINGLY UNEQUAL) PART OF TOTAL SEEK FUNDING
    Revenue above the Tier 1 maximum counts as Tier 2 revenue, and it does not receive any state equalization. The absence of equalization matters quite a bit. As noted earlier, a 20¢ unequalized tax rate will produce:
    • $600 added revenue for a district with $300,000 in property per pupil
    • $1,000 added revenue in a district with $500,000 in property per pupil
    • $1,400 added revenue in a district with $700,000 in property per pupil
    In Tier 2, districts with lower wealth brings in less revenue to use in serving their students, even when they set tax rates just like those in districts with more taxable property.

    In 2017, 171 of Kentucky’s 173 school districts set rates above their Tier 1 maximum. 148 districts went further above the Tier 1 maximum than they had gone in 2012, meaning they made a greater effort to obtain Tier 2 dollars. On average, districts increased their rates by 5.8¢, and that increase generated an average of $306 in local funding per student—but the lack of equalization meant that students in some districts received far more and others far less than that average amount.

    These erosions of Kentucky's SEEK investments are making it harder to implement and sustain the bold strategies our students and our state need.

    Sunday, November 26, 2017

    What is SEEK, Anyway? An Four-Step Explanation

    The SEEK formula is the main source of K-12 education funding for Kentucky students. SEEK is short for Support Education Excellence in Kentucky. It works by combining state and local dollars, in four main steps.

    STEP 1
    THE BASE GUARANTEE GIVES ALL DISTRICTS MATCHING BASIC FUNDING PER PUPIL
    SEEK begins by guaranteeing base funding for every student. The illustration uses a base guarantee of $4,000 (rounding slightly up from the actual current guarantee of $3,981).

    Every district must raise 30¢ per $100 of taxable property as its local contribution.


    District A has $300,000 in taxable property per pupil, so the 30¢ rate raises $900. The state provides the additional $3,100 needed to complete the $4,000 guarantee.

    District B has $500,000 in taxable property per student and raises $1,500, and the state provides the $2,500 to reach $4,000.

    District C has $700,000 in taxable property per student and raises $2,100, so the state provides $1,900 to get to the guaranteed $4,000.

    STEP 2
    ADD-ON FUNDING PROVIDES EXTRA DOLLARS BASED ON IDENTIFIED STUDENT NEEDS
    If the base guarantee is $4,000, a district will receive an extra:
    • $600 for each at-risk student eligible for free lunches (15% of base)
    • $960 for each student with communications disabilities (24% of base)
    • $4,680 for each student with moderate disabilities (117% of base)
    • $9,400 for each student with severe disabilities (235% of base)
    • $384 for each limited English proficiency student (9.6% of base)
    • $3,900 for each home/hospital services student (base minus $100)
    • A transportation amount based on analysis of transportation costs

    For simplicity, the illustration shows the three districts getting identical $2,000 funding, but districts are rarely identical. The real amounts depend on each district’s count of students with each type of need.

    STEP 3
    TIER 1 OFFERS STATE EQUALIZATION DOLLARS TO DISTRICTS THAT SET HIGHER TAX RATES
    If districts set taxes higher than the 30¢ minimum, the state equalizes that at 150% of statewide average property per pupil.

    In this example, average taxable property is $500,000 per student, and 150% of that is $750,000. A 12¢ tax rate on $750,000 can raise $900.


    With a 12¢ increase:
    • District A ($300,0000 in taxable property) will raise $360 locally and receive $540 from the state to get to the equalized $900
    • District B ($500,000) will raises $600 and get $300 from the state to reach the $900 total
    • District C ($700,000) will raise $840 and get $60 from the state to reach the $900 total
    Tier 1 allows a district to raise up to 15% more than its SEEK base and add-on funding. In the illustration, $900 is 15% of each district’s earlier $6,000.

    STEP 4
    TIER 2 ALLOWS DISTRICTS TO RAISE FURTHER DOLLARS WITHOUT ANY STATE EQUALIZATION
    If districts set tax rates above the Tier 1 maximum, they receive no additional equalization from the state. Those local-only dollars count as Tier 2 funding.


    A 20¢ increase in the tax rate will add:
    • $600 per student for District A ($300,0000 in taxable property)
    • $1,000 per student for District B ($500,000)
    • $1,400 per student in District C ($700,000)
    With no equalization, the same 20¢ tax rate raises the most money in the district with the most taxable property wealth.

    Tier 2 also has a maximum: districts are allowed to add up to 30% of the revenue they receive from their base, add-on, and Tier 1 funding.

    ADDED NOTE
    PROPERTY TAXES ARE NOT THE ONLY WAY DISTRICTS CAN RAISE THEIR LOCAL SHARE OF SEEK FUNDING
    The local share of SEEK funding does not have to be raised by taxing property. This is a tricky point, but worth knowing.

    The SEEK rules require districts to raise revenue equal to 30¢ per $100 of property as their share of the base guarantee, but they can choose to raise some of those dollars with other taxes, like taxes on motor vehicles, utilities, or occupational licenses.

    Tier 1 and Tier 2 revenue can also be raised using those other taxes.

    A four-page printable version of this explanation is also available for download and sharing.

    Friday, November 24, 2017

    Five Years: Gaps Moved In The Wrong Direction

    | Post By Susan Perkins Weston|

    Most of Kentucky’s achievement gaps grew worse between 2012 and 2017. While most historically underserved groups did see improvement, their more privileged classmates saw more improvement.

    For example, averaging all assessed subjects, 2012 Kentucky results showed:

    • 25.6 percent proficient or distinguished results for African American students
    • 47.0 percent proficient or distinguished results for white (non-Hispanic) students
    • Resulting in a 21.5 point gap between the two groups

    By 2017, equivalent results showed:

    • 29.3 percent proficient or distinguished results for African American students
    • 54.8 percent proficient or distinguished results for white (non-Hispanic) students
    • Resulting in an increased 25.5 point gap between the two groups

    Here’s how the gaps shifted for selected student groups:

    As noted in yesterday’s post, weighted average results improved for all of these groups except English learners. It is not that these groups have no progress. It is, however, a report that Kentucky has not narrowed most of its achievement gaps. In most cases, there has better progress for groups that were already ahead than for the groups that need to be accelerating and catching up. Where a gap has narrowed, the five-year improvement has been quite small.

    Kentucky’s new accountability system calls for important new emphasis on these gaps, and that added focus is clearly needed. To meet those goals, Kentucky will need bolder strategies, stronger efforts, and deeper investments.

    Gap patterns by subject are shown in more detail below.

    Wednesday, November 22, 2017

    Five Years: Student Group Results Improved Too Slowly

    | Post By Susan Perkins Weston |

    2012 to 2017 KPREP results showed proficiency progress for most historically underserved student groups, but that progress was quite slow. As shown in the chart below, English learners lost ground, and African American students gained less than five points (looking at a weighted average of all tested subjects).

     
    This small progress is better than a pattern of losses, but if improvement continues at this limited pace, reaching full proficiency will take:

    • 30 years for students of two or more races
    • 36 years for students eligible for free/reduced meals
    • 68 years for Hispanic students
    • 69 years for students with identified disabilities and IEPs
    • 96 years for African American students

    As with the slow pace for students overall (discussed in yesterday’s post), these group results reflect progress, but not the kind of progress we need for all students who are now in our schools and who must be equipped to play central roles in building our commonwealth’s future. Changing these patterns will require bolder strategies, stronger efforts, and deeper investments.

    Results for each group are shown in more detail below.

    Tuesday, November 21, 2017

    Proficiency over Five Years: Right Direction, Wrong Pace

    | Post by Susan Perkins Weston |

    From 2012 to 2017, Kentucky increased proficiency by an average of 6.9 points, or about 1.4 points per year. That’s based on considering results for all students, combined in a weighted average.

    That kind of improvement has us moving in the right direction, but at the wrong pace. If we continue at that pace, we will not be able to move halfway to 100 percent proficiency by 2030, which means we will not meet the goals set by the Kentucky Board of Education at its August 2017 meeting.

    Put another way, we will not reach 100 percent proficiency until 2053. That will be three generations after the Rose decision and eight generations after the people of Kentucky adopted a constitutional commitment to an efficient system of common schools.

    The chart below shows a more detailed picture, showing all subjects tested in both 2012 and 2017.

    This is a picture that shows progress, but not the kind of progress we need to deliver for this generation of students, the ones we hope will play central roles in building a stronger future for our commonwealth. To deliver for those students, Kentucky will need bolder strategies, stronger efforts, and deeper investments in learning.

    Notes for Number Lovers: Percent proficient or distinguished for each subject come from the school report card portal. For the weighted average I've used above, elementary and middle school writing and language mechanics were combined into one subject score, with writing getting a 80% weight and language mechanics 20%: the same distribution the Department of Education used in Unbridled Learning calculations. Then those two scores and the other 11 subjects were summed together and divided by 13 to summarize the overall trend.

    Thursday, November 16, 2017

    Five insights from the Early Childhood Cost of Quality study process

    by Cory Curl 

    Today, the Prichard Committee released the results of its Early Childhood Cost of Quality study. The study has been a year-long effort to provide state and local leaders with solid information they can use when making budget decisions designed to increase access to quality learning environments for Kentucky’s youngest children.

    Throughout this year, Prichard Committee staff have worked with a statewide advisory group, national experts, and other partners through the process of collecting data and developing cost models. We also spent a lot of time interviewing school district preschool directors and child care center directors to learn about how they target limited resources to provide quality learning environments.

    The highlight of the year, by far, was visiting with babies, toddlers, and preschoolers – and their teachers – throughout the Commonwealth.

    Here are five of the insights we learned through this journey:

    1. Quality can come down to two basic factors - encouraging teacher-student interactions that promote learning, and supporting the specialized needs of children and their families. The first factor is well-established in the research, reinforcing the need for smaller teacher-student ratios and professional training and compensation for teachers. Our visits elevated the urgent need for the second dimension of quality. We visited a few child care centers with professional staff and space for therapeutic services for children with special needs. We visited a few school districts with staff who support families in building safe, nurturing home environments for preschool children. The need for both was clear. As a result, we built in these types of staff and services into our cost models at higher levels of quality.

    2. The majority of children served in Kentucky’s preschool program have special needs. Kentucky school districts administer the state preschool program, which serves nearly 10,000 3- and 4-year olds with special needs (including around 650 with severe or multiple disabilities) and about 9,200 4-year olds in families with incomes below 160% of the federal poverty level. Classes may include as many as 20 children, and often more than half have special needs. Each classroom typically has one lead teacher and one instructional assistant. The lead teacher must hold a bachelor’s degree and interdisciplinary early childhood education (IECE) credential, which includes special education. Given the population of students served in the program, some districts have prioritized having smaller class sizes and/or additional assistants with training in special education. Our cost model builds in smaller class sizes at higher levels of quality, additional instructional assistants, and specialists to service specific child needs.

    3. Quality child care is often out of reach for low-income working families. The study, our visits, and the cost model all reinforced the incredible financial challenge of sustaining a child care center, as well as the personal financial challenge to directors, teachers, and other staff who work in centers with low compensation, often without health insurance or other benefits. Today, 50% of Kentuckians live in child care deserts and many struggle to afford quality care. To help families work and to enhance quality, Kentucky’s Child Care Assistance Program (CCAP) reimburses child care centers for providing early care and education to about 27,000 babies, toddlers, and preschoolers in working families who earn less than 160% of the federal poverty level. Our child care cost model found that the cost of providing high-quality care and education in child care centers is much higher than the state’s reimbursement rates, particularly for babies and toddlers. This was not surprising. What did surprise us was learning how much CCAP-eligible families still pay for child care through a co-pay and  what we call a “double co-pay”. For example, a center may charge $22/day for tuition for 3-year olds. The state reimbursement rate may be $18/day, of which parents pay a co-pay of $10/day. They may also pay the $4/day “double co-pay” –- the difference between the reimbursement rate and the tuition rate. Ultimately, the state reimburses the center $8/day ($160/month) while the parent pays $14/day ($280/month). Faced with these costs, low-income working families may opt to enroll their children in centers based only on what they can afford rather than quality.

    4. Local communities can design options to work for a variety of families. As we interviewed and traveled throughout the state, we saw a lot of variation across local communities in the way they are providing quality early childhood experiences to meet families’ needs. Some school districts emphasize small class sizes in a half-day preschool program while others stretch resources to offer full-day programs. Partnerships across child care, school districts, and Head Start better coordinate resources and provide more flexibility for families. Many districts allocate substantial resources to provide transportation for preschool students to remove barriers to enrollment. We concluded that there is no one-size-fits-all model for quality early care and education, and that local leaders use funds to support options specific to needs in their community.

    5. Early childhood leaders want to better serve more families. We designed the study to illuminate the cost drivers for quality early childhood environments. In our interviews with preschool and child care directors, we also asked a general question about their aspirations. If they had more funding, how would they prioritize it? Many times, they answered with a quick and emphatic, “Serve more families and children in need!” This was another reminder to us that both quality and opportunity are essential for Kentucky’s children.

    Our hope is that the Early Childhood Cost of Quality study informs the critical decisions in Frankfort and in local communities about the level of investment needed for each child to thrive in quality early learning environments. We are grateful to all of those who provided guidance, assistance, information, and encouragement along the journey.

    Friday, November 10, 2017

    Transforming school climate & culture (Notes from the annual meeting)

    Here's Prichard Committee member Justin Bathon's reporting on some great collaborative thinking at Monday's Prichard Committee meeting, crossposted from www.recode.school.

    At the recent annual meeting of the Prichard Committee for Academic Excellence in Kentucky the focus turned to transforming school climate and culture. This focus included a specific desired outcome of culture and climates which specifically promote equity of opportunities.

    Over the course of a day and a wonderful agenda, the Committee and guests heard from students, educators, national scholars, journalists, and a former U.S. Ambassador on strengthening school climate and culture. This focus transforming school climate and culture links to a recently adopted three-year strategic plan adopted at the meeting by the 100+ members of the Prichard Committee.

    In an effort to translate this learning into specific recommendations for educators and, in particular, the leaders of schools the Prichard Committee and guests worked hard to identify specific suggestions across a variety of domains of climate and culture in schools. The attendees identified the following 11 domains of the challenge.

    1. More student autonomy/agency
    2. Teacher autonomy & agency
    3. Intentional communication with parents
    4. More authentic project based learning/projects
    5. Nurture and respect educational professionals
    6. Authentic/meaningful teacher administrator dialogue
    7. Collaborative community partnerships
    8. Equal academic/sports emphasis
    9. Equity of opportunity and inclusive excellence
    10. Engaging all students
    11. State accountability of climate

    Across eight of these domains, the attendees sought to work collaboratively to identify eight specific suggestions for a total of 64 specific suggestions for educators and school leaders to improve school culture and climate toward equity of opportunity. This task was formatted into Lotus Blossom coordinated through the collaborative use of Google Docs and Google Draw. A picture of the final result is below. In the middle is the core challenge (bright green) surrounded by the 8 domains of the task (yellow). Then, each domain is explored in more detail on the petals of the lotus blossom flower (the yellow box surrounded by mostly green boxes). Finally, the colored boxes within each petal represent our identified practices that we wish to share with school leaders and other educators as the potentially most impactful near-term implementation concepts.


     Full Lotus Blossom (zoom in): http://go.uky.edu/prichard

    Once the 64 ideas were generated, we again worked collaboratively to identify our suggestions for the most impactful concepts that educators and school leaders might employ (the blue, red, orange and purple in the image). The following is the result of those impactful suggestions across the 8 domains examined in the full Lotus Blossom activity.

    1. More student autonomy/agency
    a) Assume all students can do the best work and have high expectations for all learners
    b) Employ more student internships and work-based learning experiences

    2. Increased teacher autonomy & agency
    a) Incentive teacher innovation and creativity through new supports from schools and districts.
    b) Encourage teacher ownership of professional learning communities
    c) Provide teachers leadership opportunities within schools and districts

    3. Intentional communication with parents
    a) Ensure ongoing positive communication with parents rather than emphasizing the negative.
    b) Co-design a communication plan with parents

    4. More authentic project based learning/projects
    a) Promote state, district, and school accountability systems that honors this authentic engagement work by students
    b) Provide iterative feedback and opportunities for growth to both teachers and students engaged in authentic PBL

    5. Nurture and respect educational professionals
    a) Promote culturally responsive training and support for teachers
    b) Respect educator mental health and personal time

    6. Authentic/meaningful teacher administrator dialogue
    a) More frequent formal opportunities for teacher-administrator dialogue in both 1:1 and group settings
    b) More time flexibility in school schedules to promote dialogue

    7. Collaborative community partnerships
    a) Encourage reciprocal partnership where both schools and community members benefit.
    b) Develop community asset maps to identify key resources for teachers to link to learning
    c) Develop trust and partnership through ongoing authentic dialogue

    8. Engaging all students
    a) Engage students in high expectation, high yield activities such as leadership development opportunities
    b) Build relationships with learners by promoting student voice and choice, specifically engaging in suggestions made by the Prichard Committee Student Voice Team across their multiple publications

    These excellent suggestions emerged from a day of learning and an hour of work to make our learning tangible and specific. We think these suggestions are superb entry points for educators and schools looking to improve the school culture and climate for both the adults and children who inhabit these spaces. The progress that we collectively seek as Commonwealth for our schools and children is dependent on institutions capable of strong cultures which minimize institutionalism. We are convinced that such improvements to the schools of Kentucky are possible and we look forward to working with students, educators, and community members to make robust, equitable climates and cultures.

    Monday, October 9, 2017

    2017 KPREP: Mixed results for students eligible for free/reduced meals

    Post By Susan Perkins Weston

    In 2017 KPREP results released late last month, students who qualify for free or reduced-price meals had mixed results, with improvement strong enough to narrow gaps in six of fourteen assessed subjects. On three other assessments, their results improved while results for their classmates improved faster, yielding wider gaps.

    At the elementary level, results for students eligible for free/reduced meals:
    • Improved and narrowed gaps in social studies and writing
    • Improved with a widening gap in language mechanics
    • Declined in reading and mathematics, though by less than results for their classmates
     At the middle school level, results for students eligible for free/reduced price meals:
    • Improved and narrowed gaps in reading, mathematics, and social studies
    • Improved with a widening gap in language mechanics
    At the high school level, results for students eligible for free/reduced price meals:
    • Improved and narrowed gaps only in writing
    • Improved with a widening gap in science
    • Declined in reading and mathematics, though by less than results for their classmates
    • Declined in social studies by more than results for their classmates

    2017 KPREP Results: Slow but fairly steady progress for students with disabilities

    Post by Susan Perkins Weston

    Assessment results released in late September show results students for with disabilities improving in nearly all subjects and moving forward at a pace that reduced gaps in reading at all three levels, math in elementary and middle school, social studies in elementary school, and science in high school. Overall, the pattern shows movement in the right direction, though at a slower pace than we should want for a group that has such consistently low results overall.

    At the elementary level, results for students with identified disabilities:
    • Improved in all subjects
    • Improved enough to narrow gaps in reading, mathematics, and social studies
    • Improved, though by less than results for their classmates in writing and language mechanics
      At the middle school level, results for students with identified disabilities:
      • Improved in all subjects
      • Improved enough to narrow gaps in reading and mathematics
      • Improved, though by less than results for their classmates in social studies and language mechanics
      At the high school level, results for students with identified disabilities:
      • Improved enough to narrow gaps in reading and science
      • Improved, though by less than results for their classmates in writing
      • Declined in mathematics and social studies, resulting in narrowed gaps because results for their classmates declined more rapidly
      Source note: The results shown above for students with identified Disabilities were provided by the Kentucky Department of Education. In spite of the requirements of KRS 158.649, the Department has not published results for students who do not have identified disabilities. Instead, the results shown for that group reflect calculations I made using the information the Department has released.

      Monday, October 2, 2017

      2017 KPREP: Troubling English Learner Results

      Post by Susan Perkins Weston

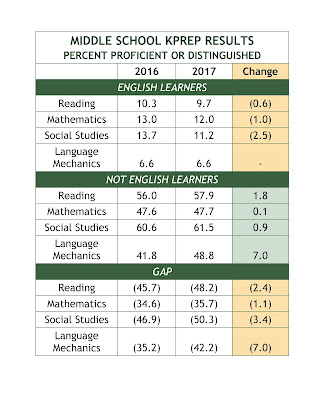
      Compared to 2016, English learner results show rising levels of proficiency on only four of 14 KPREP assessments, narrowing only three achievement gaps compared to classmates who are not English learners.

      In 2016, Kentucky's English learners had the lowest proficiency levels and the largest gaps of any student group. Seeing them slip further in 2017 warrants special concern and attention.

      At the elementary level,  English learner proficiency levels:
      • Declined in reading by more than results for other students
      • Declined in mathematics by less than for other students
      • Rose in social studies and writing by less than results for other student improved
      • Declined in language mechanics while results improved for other students
      • Narrowed the gap only in mathematics
      At the middle school level,  English learner proficiency levels:
      • Declined in reading, mathematics, and social studies while results for other students rose
      • Saw no change in language mechanics while other students gained
      At the high school level,  English learner proficiency levels:
      • Rose in reading while results for other students declined
      • Declined in mathematics by less than results for other students dropped
      • Declined in social studies and science by more than results for other students
      • Rose in writing by less than results for other students improved
      • Narrowed gaps only in reading and writing
      Source note: The results shown above for English learners were provided by the Kentucky Department of Education. In spite of the requirements of KRS 158.649, the Department has not published results  for students who are not English learners. Instead,  the results shown for that group reflect calculations I made using the information the Department has released.