Monday, July 27, 2015

How People Learn: More on Synapse Development

Last week's post on synapse development drew a comment with questions:
I wonder what the research shows for different age groups, and if the results vary, regarding synapse development. I wonder how long synapse development continues!
From How People Learn, here's some background on those issues.

There are two different patterns to how we develop synaptic connections.

In one process, "synapses are overproduced and then selectively lost." That process is especially in early development, and the time it takes varies depending on the part of the brain, " from 2 to 3 years in the human visual cortex to 8 to 10 years in some parts of the frontal cortex."

The other process lasts all  the way through life, and involves adding new synapses as one adds experiences.

Noting the two different processes seems to fit the simultaneous ideas that the early years especially important and yet learning is a lifelong process.

Thursday, July 23, 2015

How People Learn: Synapse Building For Rats (And Humans)

Continuing in my summer book study...

In the book How People Learn, the chapter on "Mind and Brain" is heavy on neuroscience, starting with the essential process of synapse development.  Our synapses are connections between neurons, and substantial research shows that learning occurs through synapse development.  Much of the chapter is about studies of what does and does not produce rich synaptic development in lab animals.
One group of rats was taught to traverse an elevated obstacle course; these "acrobats" became very good at the task over a month or so of practice.  A second group of "mandatory exercisers" was put on a treadmill once a day, where they ran for 30 minutes, rested for 10 minutes, then ran another 30 minutes.  A third group of "voluntary exercisers" had free access to an activity wheel attached directly to their cage, which they used often.  A control group of "cage potato" rats had no exercise.
Researchers then examined the rats' brains, looking both for blood vessel development and for synapses per neuron, and found that both sets of exercisers had higher density of blood vessels than the acrobats and cage potatoes, but
But when the number of synapses per nerve sell was measured, the acrobats were the standout group.  Learning adds synapses; exercise does not.
What struck me in this was something I'm not sure the the authors meant me to notice: I heard the word "exercise" in its classroom context, as meaning an activity assigned by the teacher, often with repetitions and an emphasis on speed, like spelling lists and sets of arithmetic problems.

I wonder how many of our teaching traditions reflect the idea that the brain is like a muscle and will build through steady repetition that truly resembles physical exercise.

More than that,  I wonder how much we will need to change if we want learning that happens as developing sets of synaptic connections.  That understanding suggests that the some of the most important work comes in the opportunities to "put things together " and "see how it all connects."

It seems likely that learning of that kind will require fewer drills and more exploration, fewer lists and more reasoning about how different elements relate, fewer details and more depth on key organizing concepts than we have expected in the past.  That does not have to  mean no drills, no lists, and no details.  It does mean realizing that exploration, reasoning, and organizing concepts must be given a rich share of the time and energy students bring to their learning.  And it does mean that the number of drills, lists, and required details has to be restrained to allow the richer elements opportunity to occur.

Thursday, July 16, 2015

Kentucky School Staffing (National Comparisons)

In the fall of 2012, Kentucky enrolled 1.38 percent of all students enrolled in public schools nationwide in pre-kindergarten through grade 12.

Our share of public school staff was at or below that 1.38 percent level in three categories, with Kentucky having:
  • 1.02 percent of student support staff nationwide
  • 1.21 percent of administrative support staff
  • 1.36 percent of officials and administrators
  • 1.38 percent of teachers
Our share of public school staff was above the nationwide level in the other categories, including:
  • 1.46 percent of guidance counselors
  • 1.48 percent of Instruction coordinators
  • 1.87 percent of Instructional aides
  • 1.94 percent of principals and assistant principals
  • 2.09 percent of school and library support staff
  • 2.10 percent of other support services staff
  • 2.33 percent of librarians
If instead, Kentucky schools and districts had consistently had 1.38 percent of each kind of staff, we would have had:
  • 1,021 additional student support staff members
  • 325 additional administrative support staff
  • 136 more teachers
  • 10 more officials and administrators
  • 7 fewer guidance counselors
  • 69 fewer instruction coordinators
  • 443 fewer librarians
  • 955 fewer principals and assistant principals
  • 2,028 fewer school and library support staff
  • 3,560 fewer instructional aides
  • 8,225 fewer other support services staff
Back in March 2009, I posted a similar analysis using Fall 2005 data. As I wrote then:
I’m not arguing that Kentucky should staff schools to those averages. There may be important benefits to what we do differently, and our students may have different needs. I do think, though, that this is an interesting mirror to look in, inviting us to think about how we currently staff public education.
Coming back to this analysis this time, I still see that issue, and I have these added thoughts:
  • We have 1,087 librarians spread over more than 1,200 schools. That may be the starting example of where our added commitment is a good idea, especially as we ask students to go deeper on research, designing their own investigations, and learning through major projects. 
  • We’re now asking our principals to do sustained observations and give thoughtful feedback for every teacher: for that big growth in responsibility, our added numbers may again be just right.
  • Other support staff seem likely to include food workers, custodial workers, and bus drivers. In other states, that work is often handled by contracting companies, and it's possible that Kentucky isn't so much engaging more workers as engaging them in  a way that shows up under staff rather than service fees.
  • I'd love to know what other states are doing (and Kentucky apparently isn't) in student support services!
Source note: the data for this analysis comes from the Digest of Education Statistics, using tables 203.40 and 213.20 The staff analysis is based on full-time equivalent positions.

Wednesday, July 15, 2015

How People Learn: Learning That Transfers To New Contexts

Continuing my summer book study...


"Transfer from school to everyday environments is the ultimate purpose of school-based learning."  That's the kind of statement that seems obvious and turns out to be important. In How People Learn, the transfer process gets close attention--and now it's got mine as well.

Here, transfer is about ability to use knowledge in multiple contexts. For example, veteran shoppers can be very good at figuring out cost per unit and identifying bargains, but struggle with related division when dropped into a formal classroom.  Conversely, most of us have watched kids part way through elementary school who aren't at all sure which bit of "school math" to use in stores. The studies in the book give examples like seeing if Latin or computer programming develops logical reasoning for other kinds of work and sorting out which kinds of simulations create lasting and useful understanding. If you've learned something that you can only used in the situations that are most like being in school, it isn't going to be a lot of help for other kinds of challenges.

With research citations for each claim, the chaper looks at what scientists know about when transfer is and isn't likely to succeed. Some major points:
  • Time spent on understanding how a process works and when it matters yields better transfer than memorization.
  • Teaching a set of knowledge in multiple contexts makes the learners more able to transfer it.  
  • Transfer is also improved when students are equipped to monitor their own understanding and evaluate their own progress (with "metacognition" as the power word for that process of learning about their own learning.)
All through this section, I was haunted by images students doing worksheets and computer drills to prepare for a math assessment. 

The research in this study gives support to parent concerns that a certain kind of "teaching to the test" creates knowledge that will be only useful on the test. That can be learning for a single context, focused on procedural accuracy, with little insight into how or why the same knowledge could be put to work elsewhere.

Plus, what happens if the school's response to early difficulty is more of the same kind of drill, and more, and more and more again? On this understanding of learning, students may succeed on this year's test, but not be able to transfer that knowledge to next year's work or future challenges. 

That "learning that doesn't transfer" may be central to what's going on when middle school teachers say kids come from elementary school lacking key skills, and high school teachers say that about middle school, and college teachers and employers say it about high school graduates. The folks at the lower level know they worked on that exact skill, but don't know why kids can't put it to use as they move on. The issue may be quality of learning, with students needing to move well past memorization into understanding why the knowledge matters, using it in multiple contexts, and joining in evaluating their understanding as the work goes on. Adding to the quantity of work a student turns in may not change the long-term results much at all.

One final connection: Kentucky has committed to standards that are "fewer, higher, and deeper." Learning that can transfer may take more intensive study, and that's part of why it matters to have a shorter list of expectations with deeper demands about putting understanding to active use.  This chapter adds to my sense that we're on the right track in that approach, and we'd be moving in the wrong direction if we added lots of detailed demands to our standards documents.


Friday, July 10, 2015

Kentucky's Tests Are Harder Now

A new National Center for Education Statistics study provides a sturdy basis for thinking about how our K-PREP assessments, launched in 2012, compare to the earlier Kentucky Core Content Tests.  The study worked out a 2013 NAEP scale score equivalent to scoring proficient on each state's 2013 reading and mathematics assessment, using NAEP's 0-500 scale.  The results for Kentucky are consistently higher than similar findings from 2009, providing a quick, helpful confirmation that Kentucky really is aiming higher.

Sources: 2013 and 2009 comparison studies here, with a hat tip to EdWeek's Curriculum Matters blog.


Thursday, July 9, 2015

Universities: Enrollment Up, With Degrees Up Faster

For undergraduate learning at Kentucky public institutions, the last decade has been a period of growth. Together, the state's universities have added the equivalent nearly 7,500 full-time students: an 8% increase. In the same period, they've added more than 3,500 degrees to their annual list of graduates, and that's a much bigger 26% increase (though still smaller than the 54% jump for KCTCS).


Why do these numbers look better than the graduation rates? To return to what's becoming a recurring PrichBlog point, postsecondary graduation rates consider only students who enroll full time, stay at the same school, and finish within six years. The bachelor degree total above considers part-time as well as well as full-time, transfers as well as students who stay put, and degrees awarded no matter how long it took to get there. The total also must include some students who started at KCTCS and some cases where one person collected more than one degree, though I haven't yet figured out how often those two things happen.

Source: the Kentucky Council on Postsecondary Education's data portal, looking under student enrollment and under retention and graduation rates.

Wednesday, July 8, 2015

How People Learn: Experts and Novices

Diving into my promised book study...

Chapter 2  of "How People Learn" focuses on research about how experts in varied fields differ from newer learners.  The studies range from chess masters and mathematicians to experts in programming and history, and I'll grab two important ideas from the set of principles.

One is about learners getting to mastery of the big ideas. I'm reading that "experts have acquired a great deal of content knowledge that is organized in ways that reflect a deep understanding of their subject matter" and also that "experts notice features and meaningful patterns of information that are not noticed by novices." For both versions, I'm thinking of the ways middle school students take on their music collection or their sports-passion. It's not on the scale of the major disciplines, but I think it's the same process of getting to where you really can see the forest and understand the trees.


For education, the biggest implication is that learners need lots of exposure to get the main ideas and see how they work with varied examples.  If they're just asked to learn many separate bits, they can't possibly remember of use what they've encountered.  For education policy, this explains the importance of setting up short, coherent lists of standards: that's what allows the time for students to go deep enough to develop an organized, meaningful sense of what they study.

The other is the new idea (for me) of "conditionalized knowledge," which seems to mean that experts can quickly mobilize the part of their knowledge the fits their current challenge.  The first research example involves expert chess, in which the players turned out to consider just a handful of responses to a given arrangement of pieces, and all of them strong responses.  Because they've learned to which parts of their understanding fits different circumstances, "experts are able to flexibly retrieve important aspects of their knowledge with little attentional effort."

Reading, I can hear teenagers asking over and over: "when will we use this?"  They're trying to figure out where the knowledge fits, and they're hunting for a conditionalized version of the knowledge they're asked to absorb.  The research in this chapter on experts and novices suggests that if schools caninvite students to find good answers to those questions, that will be a big step toward equipping them to develop, keep, and use what they learn.

Both of these ideas seem most relevant as supports for the second central idea of the book: "To develop competence in an area of inquiry, students must: (a) have a deep foundation of factual knowledge, (b) understand facts and ideas in the context of a conceptual framework, and (c) organize knowledge in ways that facilitate retrieval and application."

Monday, July 6, 2015

KCTCS: Enrollment receding, but maybe not degrees?

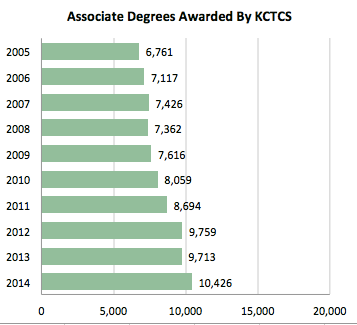
It's easy to see the Great Recession in this chart of KCTCS enrollment. There was some rapid growth in the years when jobs were especially hard to find (and federal supports made added learning easier to afford), but a noticeable decline as the economy has recovered.

That enrollment decline makes it especially interesting to see associate degrees still climbing as of last year.  Since students who started in 2011 could be expected to finish in 2013 or 2014, 2015 may be our year to see a drop off.  Even so, the deeper education benefits of those degrees will last for decades, providing a rare silver lining to the difficult economy of the recent past.


Source: the Kentucky Council on Postsecondary Education's data portal, looking under student enrollment and under retention and graduation rates.

.

Sunday, July 5, 2015

How People Learn (a little summer book study)

As the world still slows down (a little, just a little) in July, maybe a real book is possible?  Sally Kilgore lured me out of consumer law and into education 28 years ago, and Sally says I need to read How People Learn: Brain, Mind, Experience, and School. So, over the next few weeks, I'm going to dig in.

The book "synthesizes the scientific basis of learning," drawing on the wide body of research that was available in 1999. It will, of course, be out of date on some issues, but from the chapters I've read so far, it's clearly dealing in large concepts supported by many studies. Those ideas are sure to have been refined in the intervening years, but few are likely to have been overturned.

So, to begin.

Three key findings are highlighted in the introduction:
1. Students come to the classroom with preconceptions about how the world works. If their initial understanding is not engaged, they may fail to grasp the new concepts and information that are taught, or they may learn them for purposes of a test but revert to their preconceptions outside the classroom. 
2. To develop competence in an area of inquiry, students must: (a) have a deep foundation of factual knowledge, (b) understand facts and ideas in the context of a conceptual framework, and (c) organize knowledge in ways that facilitate retrieval and application.
3. A "metacognitive" approach to instruction can help students learn to take control of their own learning by defining learning goals and monitoring their progress in achieving them.
All of these ideas are familiar to me in one sense and ripe for thoughtful exploration at another.

The challenge of preconceptions was central to a very long lunch with Brent McKim in 2007 or 2008. My understanding of that idea is still fragile, tied to  physics in particular, so I'm looking forward to a developing a broader, as well as deeper, understanding.

The competence issue, with its attention to deep knowledge and strong frameworks, puts a deeper foundation under the string of early PrichBlog posts (here and here, here and here) on how reading requires knowledge, which I usually link to the work of E.D. Hirsch on cultural literacy. Again, looking forward to going deeper.

And reading the definition of metacognitive work, I suddenly understand that it's deeply tied to what Kentucky educators mean by "assessment for learning" or "the Stiggins work" (PrichBlog roundup here). Roger Marcum gets the hat tip for pulling me into that discussion, and it'll be great to get the foundational thinking on an approach valued so widely across the commonwealth.

I'll share as I go, interspersed with PrichBlog's usual diet of data and news, and I'd love questions and comments as they occur to our wonderful PrichBlog readers.
.

Wednesday, July 1, 2015

Readiness Trends (Added Detail!)

In recent years, Kentucky has expanded the evidence we use to show that Kentucky students are ready for college, career, or both, and this post shows some of the details of how that expansion has worked. First, a graph to show what's changed:

 Next, some background about the parts of the graph:
  • For 2010, the graph shows the total percent of public high school graduates who met all three ACT readiness benchmarks (English, mathematics, and reading) set by the Council on Postsecondary Education. It combines the students who met those benchmarks while participating in the statewide required 11th grade administration of the test and those who retook the test and reached the benchmarks at a later date.
  • Starting in 2011, students who reached the benchmarks on the 11th grade statewide administration are shown separately from those who reached the benchmarks later on.
  • Starting in 2012, student success on Compass and KYOTE placement tests, used by universities and KCTCS to assign students to courses, can also be seen. More exactly, students who have not met all three ACT benchmarks can be counted as college ready based on scores from Compass, KYOTE, a combination of subject scores from both tests, or a combination of scores from those two tests and ACT.  
  • Also starting in 2012, career ready students are included. For career readiness, students must reach required scores on the Armed Services Vocational Aptitude Battery (ASVAB) or ACT WorkKeys to show academic readiness, and they must also meet needed scores on a Kentucky Occupational Skills Standards Assessment (KOSSA) or earn an industrial certificate to show technical readiness.
The newest results, adding up to 62% of 2014 graduates being counted as ready for college and career, provide the most complete information. The 2014 information includes data from all the assessments Kentucky recognizes as showing readiness. 2014 also reflects an culture in which schools encourage students to prepare for and take additional assessments, especially if their early ACT scores show that they need to improve.

In contrast, the 2010 results are clearly incomplete. The 30% shown as ready reflect only the ACT results. We know that some Kentucky students took each of the other assessments in those years, but their results are not included. Plus, schools had less incentive then to encourage students to try the other ways of demonstrating readiness, so some students may have been ready but not taken any test to make that easy to see.

And, of course, none of the results are superb indicators of the full results we really want for our students. The available assessments can't track students' capacity for sustained work, like using reading skills to research a problem and writing skills to explain a possible solution or taking on a real-world challenge and applying their mathematics skills to wrestle their way to a sound response. They also give very little indication of students' perseverance, teamwork, and other capacities that we know matter deeply for college and career success.

Still, the available information clearly shows Kentucky students as increasingly able to show their readiness as measured by the available assessments, and the same information makes it clear that we have plenty more work to do to make sure every student is equipped for adult success.

Source note: the graph above combines several slides from a December presentation given by the Office of Education Accountability.  See below for the way OEA displayed the same results.


.