Friday, May 10, 2013

Speaking and Listening (CCSS Goes Deep)

The Common Core State Standards reach beyond reading and writing to address speaking and listening.  The anchor standards for college and career readiness come under two headings and look like this.
Comprehension and Collaboration
1. Prepare for and participate effectively in a range of conversations and collaborations with diverse partners, building on others’ ideas and expressing their own clearly and persuasively.
2. Integrate and evaluate information presented in diverse media and formats, including visually, quantitatively, and orally.
3. Evaluate a speaker’s point of view, reasoning, and use of evidence and rhetoric.  
Presentation of Knowledge and Ideas 
4. Present information, findings, and supporting evidence such that listeners can follow the line of reasoning and the organization, development, and style are appropriate to task, purpose, and audience.
5. Make strategic use of digital media and visual displays of data to express information and enhance understanding of presentations.
6. Adapt speech to a variety of contexts and communicative tasks, demonstrating command of formal English when indicated or appropriate.
Through the Literacy Design Collaborative, I'm seeing lots of potent work on these skills, with students becoming more able to do this work and teachers developing new insights into what further support and challenge students will need.

I'm a bit more puzzled about whether states can and will assess these skills in a standardized way.

Maybe the answer will be that, to learn academic content and make sense of complex texts they read, students will need to use these kind of speaking and listening as part of how they sort out what they are studying, and to write their own strong pieces, they will need to use similar skills on the way to organizing their work.  I see many LDC teachers adding those steps as means to the end of strong writing about important reading and essential questions in academic fields.

 Or, possibly, innovative districts like my own Danville Independent will work out richer ways for students demonstrate this sort of skill, moving us beyond what "pencil and paper" or "keyboard and screen" assessments can measure well.

Or, perhaps, some other approach is already being developed for these issues.  Part of the genius of Common Core is that, because many states have the same goals, an innovative approach can be used many places.  For all kinds of organizations working to support schools and students, that means each effort that works can spread farther and make a bigger difference.

Thursday, May 9, 2013

Writing Many Ways, For Many Reasons


10. Write routinely over extended time frames (time for research, reflection, and revision) and shorter time frames (a single sitting or a day or two) for a range of tasks, purposes, and audiences.
Ultimately, writing is a skill for adult life, growing steadily more important in an information age.  This last Common Core writing standard calls for writing to become a reliable, flexible habit for all students by the time they complete high school, so that they are ready for college and career success. 

That writing won't all be sonnets and it won't all be work memos: the writing the next generation will do will have varied goals and styles and deadlines, but Common Core aims for them to be ready to participate, contribute, and write in the ways that are valuable for their future and ours.

You can download the complete Common Core State Standards here. They were developed by organizations of governors and chief state school officers like Kentucky's Commissioner of Education, and they've been adopted by 46 states (47 for the mathematics standards).

Wednesday, May 8, 2013

Writing to Build and Share Knowledge (CCSS 7-9)

7. Conduct short as well as more sustained research projects based on focused questions, demonstrating understanding of the subject under investigation.  
8. Gather relevant information from multiple print and digital sources, assess the credibility and accuracy of each source, and integrate the information while avoiding plagiarism.  
9. Draw evidence from literary or informational texts to support analysis, reflection, and research.
Here are three more Common Core anchor standards for writing.  These focus on what goes into the writing, expecting students to gather and organize evidence, rather than just invent their pieces by imagining or imitating adult debates.   They build on the three kinds of writing (argumentation, explanation, and narrative) and the three skills for producing and distributing those writings, and again, I think they're the right thing to work on.

Standard 8 is especially valuable.   Assessing sources has always been key to well-informed citizenship, and it's become even more important as the Internet makes so many texts available with so little filtering for quality.  The next generation will need to be able to use those resources wisely, and Common Core calls for us to equip them to do that well.

You can download the complete Common Core State Standards here. They were developed by organizations of governors and chief state school officers like Kentucky's Commissioner of Education, and they've been adopted by 46 states (47 for the mathematics standards).

Monday, May 6, 2013

Teacher Salaries, Dropout Rates, Length of School Term, Functional Illiteracy.....

Teacher Salaries, Dropout Rates, Length of School Term, Functional Illiteracy.....

http://blogs.edweek.org/edweek/engagement_and_reform/2013/05/teacher_salaries_dropout_rates_length_of_school_term_functional_illiteracy.html

Writing to Argue, Explain, or Tell a Story (CCSS 1-3)

1. Write arguments to support claims in an analysis of substantive topics or texts, using valid reasoning and relevant and sufficient evidence. 
2. Write informative/explanatory texts to examine and convey complex ideas and information clearly and accurately through the effective selection, organization, and analysis of content. 
3. Write narratives to develop real or imagined experiences or events using effective technique, well-chosen details, and well-structured event sequences.
The Common Core State Standards for Writing call for students to produce three kinds of texts: the words above are the anchor standards for college and career readiness for "text types and purposes."

Common Core also shows grade-by-grade steps on the way to each of those anchor standards. For instance, Standard 2 is expanded to ask first graders students to "Write informative/explanatory texts in which they name a topic, supply some facts about the topic, and provide some sense of closure."  That's right for that age group, and then growth is added year by year.  By fifth grade, students are asked to:
2. Write informative/explanatory texts to examine a topic and convey ideas and information clearly.
a. Introduce a topic clearly, provide a general observation and focus, and group related information logically; include formatting (e.g., headings), illustrations, and multimedia when useful to aiding comprehension.
b. Develop the topic with facts, definitions, concrete details, quotations, or other information and examples related to the topic.
c. Link ideas within and across categories of information using words, phrases, and clauses (e.g., in contrast, especially).
d. Use precise language and domain-specific vocabulary to inform about or explain the topic.
e. Provide a concluding statement or section related to the information or explanation presented.
I've lived pretty much my whole life with college professors, and I'm pretty sure I understand what they hunt for in student writing and don't always find.  That fifth grade standard, halfway through the school progression, already aims to move students higher than what postsecondary programs currently see from some high school graduates.   Students who move past that to meet the grade 11-12 version of the standards will be ready for excellent work and robust futures.

Common Core is about giving students a shot at that level of skill.  It's the right bar, and I'm glad we're aiming to lift all Kentucky students to that level.

You can download the complete Common Core State Standards here. They were developed by organizations of governors and chief state school officers like Kentucky's Commissioner of Education, and they've been adopted by 46 states (47 for the mathematics standards).

Friday, May 3, 2013

Reading for Literature AND Information (CCSS 10)

10. Read and comprehend complex literary and informational texts independently and proficiently.
Above, the tenth and last of the Common Core anchor standards for reading.

This standard sums up the three "key ideas and details" standards,  the three "craft and structure" standards, and the three "integration of knowledge and ideas" standards I blogged earlier this week.   It adds that students need to be able to handle the complexity of documents they will have to use on the job and in higher education.

It also carries two additional points central to Common Core:

  • First, "complex texts" are what students must master.  Appendix A to the Common Core lays out the key reasons, giving evidence that students who can handle simple readings may not be ready for the reading that matters for adult success, and plenty of evidence that the reading needed for adult success is getting more demanding as technology and global competition expand.
  • Second, reading literary texts--both fiction and eloquent non-fiction--is part of what students should be able to do, but not all of what they need.  They also must be able to read about community, national, and global issues, political challenges, scientific discoveries, and technical applications of those discoveries.  Recently, there's been an odd worry that English teachers will have to teach the informational texts and end up dropping most poems and plays, but that's simply a mistake.  Common Core is quite clear that informational reading should happen most of all in science and history and career/technical classes, so that students are reading to learn those important fields.


To be clear, I don't think Common Core is a magic wand that solves all problems. On the contrary, our teachers have plenty of further work to do, designing how they'll teach each day, check what students have learned, and make ongoing adjustments to move each student to these standards. But setting clear, brief, very high, very smart standards, Common Core lays the right cornerstone so that teachers have solid place to start on the rest of the building.  I think we've done this step right, and I'm proud that Kentucky is leading the nation on the steps that come next.

Next week: writing standards.

You can download the complete Common Core State Standards here. They were developed by organizations of governors and chief state school officers like Kentucky's Commissioner of Education, and they've been adopted by 46 states (47 for the mathematics standards).

Thursday, May 2, 2013

Reading To Think Through Information and Ideas (CCSS 7-9)

7. Integrate and evaluate content presented in diverse media and formats, including visually and quantitatively, as well as in words. 
8. Delineate and evaluate the argument and specific claims in a text, including the validity of the reasoning as well as the relevance and sufficiency of the evidence. 
9. Analyze how two or more texts address similar themes or topics in order to build knowledge or to compare the approaches the authors take.
Here are three more Common Core anchor standards for reading.  Where the first three asked students to work on "key ideas and details," and the second three asked them to understand the "craft and structure" of that they read, these three focus on "integration of knowledge and ideas."

Standard 8 is my very favorite part of the whole Common Core process, because it asks students to track the evidence and check whether each author's positions are well grounded in reliable facts and sensible reasoning.  To me, that sounds like the basics of citizenship preparation, and close to the root of why America has public schools.

Standard 8 is also my inspiration for this set of blog posts.  For those who are wary about Common Core, I say they should start by reading Common Core.  If you think they're wrong for Kentucky's kids, say which part you think is wrong, quoting from the actual text.  Wrestle the real document and the real evidence, and don't settle for anyone else's summary.

You can download the complete Common Core State Standards here. They were developed by organizations of governors and chief state school officers like Kentucky's Commissioner of Education, and they've been adopted by 46 states (47 for the mathematics standards).

Wednesday, May 1, 2013

Reading to See How the Words Work (CCSS 4-6)

4. Interpret words and phrases as they are used in a text, including determining technical, connotative, and figurative meanings, and analyze how specific word choices shape meaning or tone.  
5. Analyze the structure of texts, including how specific sentences, paragraphs, and larger portions of the text (e.g., a section, chapter, scene, or stanza) relate to each other and the whole.  
6. Assess how point of view or purpose shapes the content and style of a text.
The lines above are the second set of Common Core anchor standards, focused on "Craft and Structure," and listed right after the three on "Key Ideas and Details." In Kentucky and most (not all) other states, teachers are now working to equip students to do those three things by the end of high school, so that they will be ready for college and career success.

I think these are smart things to expect.  Words don't mean the same thing in every sentence, and readers need to be able to use all the available clues to figure out how each part of a story, article, opinion piece, technical manual, or other reading works.

I am delighted that Kentucky teachers are now working out how to meet this standards, moving step by step from kindergarten to the end of high school to get Kentucky students ready to read this way as adults.

You can download the complete Common Core State Standards here. They were developed by organizations of governors and chief state school officers like Kentucky's Commissioner of Education, and they've been adopted by 46 states (47 for the mathematics standards).

Tuesday, April 30, 2013

Reading for Key Ideas and Details (CCSS 1, 2, 3)

1. Read closely to determine what the text says explicitly and to make logical inferences from it; cite specific textual evidence when writing or speaking to support conclusions drawn from the text.  
2. Determine central ideas or themes of a text and analyze their development; summarize the key supporting details and ideas.  
3. Analyze how and why individuals, events, and ideas develop and interact over the course of a text.
In the Common Core State Standards (CCSS), the three sentences above are the first three reading standards.  More exactly, they are the college and career readiness anchor standards, defining what we want students to know and be able to do by the end of high school.

To reach those anchor standards, students will need to move up a ladder of standards specific to different grades and subjects, and Common Core also shows how the skills should develop over time.  For example, to meet the overall Standard 2, students should be able to
  • "Retell stories, including key details, and demonstrate understanding of their central message or lesson" in grade 1.
  • "Determine a theme of a story, drama, or poem from details in the text, including how characters in a story or drama respond to challenges or how the speaker in a poem reflects upon a topic; summarize the text" in grade 5.
  • "Determine the central ideas or information of a primary or secondary source; provide an accurate summary of how key events or ideas develop over the course of the text" in grade 9-10 history reading.
  • "Determine the central ideas or conclusions of a text; trace the text’s explanation or depiction of a complex process, phenomenon, or concept; provide an accurate summary of the text" in grade 9-10 science and technical reading.
I support Common Core and Kentucky implementation of Common Core because I love these expectations.  They ask students to read to figure things out, carefully, making sure they understand what the author said and meant, so that they can make good use of what they learn.

You can download the complete Common Core State Standards here. They were developed by organizations of governors and chief state school officers like Kentucky's Commissioner of Education, and they've been adopted by 46 states (47 for the mathematics standards).


Thursday, March 21, 2013

Is Kentucky private school enrollment declining?

Using data from the 2011 Digest of Education Statistics, here's a graph that does seem to show a trend: 
The notes for the relevant table add that the numbers come from the NCES "Private School Universe Survey (PSS), 1999-2000 through 2009-10."  

Public school enrollment numbers seem to have risen in all but one year of the same period:


For this graph, the 1999 figure comes from the 2011 Digest and the others from one of the recently released "selected tables" from the 2012 Digest.

Thursday, January 10, 2013

A bar exam for teachers? A lawyer's opinion

In The Atlantic Monthly, Joel Klein makes "The Case for a Teacher Bar Exam."  His argument includes a commitment to both greater respect and greater strength in the teaching profession, and the tool he proposes is build on earlier ideas from Albert Shanker of the AFT.  Klein writes:
In a 1986 paper, [Shanker] explained that "unless we go beyond collective bargaining to the achievement of true teacher professionalism, we will fail in our major objectives: to preserve public education in the United States and to improve the status of teachers economically, socially, and politically."  
If we're going to look to Finland as a role model and an indicator of difference, then it's well past time for us to go back to Shanker's future.  
But how do we get where we need to go? Here, too, Shanker was visionary. We need to start by insisting on a rigorous entry exam for those who teach, along the lines of the bar exam for lawyers or the national medical exam for doctors. Shanker actually proposed a three-part national exam: first "a stiff test of subject matter knowledge," followed by a second test on "pedagogy ... [including] the ability to apply educational principles to different student developmental needs and learning styles." Then, for those who passed both, he recommended a "supervised internship program of from one to three years in which teachers would actually be evaluated on the basis of how well they worked with students and with their colleagues."
The comparison to entry into the legal profession is apt--but not apt enough.

Every lawyer knows that the deep learning to serve clients happens on the job, and that success depends heavily on good feedback from mentors and good dialogue with peers in the first few years of practice.  The tests and the job evaluations matter, but the support matters more.

More and more, that opportunity for professional engagement strikes me as the great puzzle of teaching quality:  How can teachers be empowered to "get smarter off of one another?"

Or, to put it personally: How can each teacher get as much support from veteran teachers as I got from the senior attorneys in my first office?  How can each one get as much rich an opportunity to think through professional issues as I got with the first and second year lawyers in the offices around me?

Most of all, how can those of us in other professions, knowing how we grew in our various chosen crafts, get serious about ensuring that teachers get equivalent support in their own?

Klein does suggest that the examination approach would create leverage to get other needed changes: improved admissions and curriculum in teacher preparation programs and better career ladder options for the strongest teachers are included on his list.  He is thinking clearly about many of the pieces of professional reform.  I just wish he would think more clearly about the essence of professional interaction and professional growth, comparing his own early experience to what is possible and impossible for a first or second year teacher in most American schools today.

Noting Successes and Challenges Key to Measuring True Progress


http://blogs.edweek.org/edweek/engagement_and_reform/2013/01/noting_successes_and_challenges_key_to_measuring_true_progress.html

Friday, January 4, 2013

Thursday, January 3, 2013

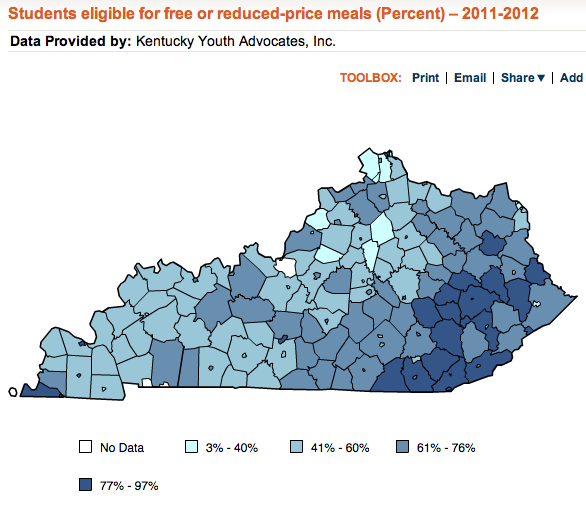
Where poverty hits hardest (KidsCount data!)


The map above comes from the newly-released 2012 KidsCount reporting on individual school districts, counties, and congressional districts.  In it, you can see a fresh illustration of how many students across the state are growing up in homes with low incomes.

You can also see an illustration of how those difficulties cluster across the state.  The eastern  counties grab the eye, and don't miss Fulton at the opposite end of the state.  Since they're harder to see, I'll also note that there are a set of independent districts also in the dark, difficult blue:

  • Covington, Dayton, Newport, and Silver Grove in the north.
  • Middlesboro and Jenkins in the east.
  • Caverna in the central west.
  • Fulton Independent, Mayfield, and Paducah in the far west.

I love the way the Kids Count maps include the range, letting you know that the state ranges from 3% to 97% participation in the free and reduced-price meal program.  To illustrate where that range occurs, I'll include tables below listing the highest 10 and lowest 10 participation rates.  I do hope you'll play with the KidsCount information for yourself, and I'm working on several more posts on what I'm seeing as I explore.

Tuesday, December 18, 2012

Wednesday, December 12, 2012

Common Core Reading: A Full Range of Texts

I've now seen multiple authors claim that the Common Core State Standards mandate that reading and English classes can only have 50% of their texts be literature, with the other 50% a variety of non-literary readings.  For example, there's this new Heritage Foundation publication, and last month there was this (now corrected) New York Times piece.

That claim is untrue, and this post offers a review just how and why it is false.

Lets start with the one place that Common Core uses the number 50%: it's in this table on page 5 of the official standards document:
The document then explains that the Standards "aim to align instruction with" the NAEP reading framework, which does mean 50% literary reading in grade 4 and then smaller shares in grade 8 and grade 12.   

The thing is, that does not mean 50% of an elementary school's reading hour or 30-45% of the one period a day the upper grades devote to language arts and English.  Common Core stakes a claim to the full instructional day and homework time beyond that.  

Here's the key Common Core statement that appears right below that table:
In K–5, the Standards follow NAEP’s lead in balancing the reading of literature with the reading of informational texts, including texts in history/ social studies, science, and technical subjects. In accord with NAEP’s growing emphasis on informational texts in the higher grades, the Standards demand that a significant amount of reading of informational texts take place in and outside the ELA classroom. Fulfilling the Standards for 6–12 ELA requires much greater attention to a specific category of informational text—literary nonfiction—than has been traditional. Because the ELA classroom must focus on literature (stories, drama, and poetry) as well as literary nonfiction, a great deal of informational reading in grades 6–12 must take place in other classes if the NAEP assessment framework is to be matched instructionally.  [emphasis added]
Why does Common Core call for literature and more, studied in English classrooms and many others?

It's because today's students will read widely as tomorrow's adults:

  • In their careers and postsecondary education, they'll need to read everything from scientific research and economic analysis to manuals for advanced machinery and guidance on implementing complex legal requirements.
  • As citizens and community participants, they'll need to read analysis of current events, speeches, editorials, historical explanations, and on and on. 
  • As members and builders of our shared culture, naturally they'll also need to engage literature and richly literary nonfiction. 

For our next generation, reading will be a mix of all those kinds of texts, so Common Core calls on our schools to equip them for that full range of expectations.

In fact, the  document's proper name is "Common Core State Standards for English Language Arts & Literacy in History/Social Studies, Science, and Technical Subjects."  The proof that  Common Core aims for high levels of fluency with literature and other reading texts, learned in English and other classrooms, is right there on the cover.

One more thing:  Kentucky science, history, and other teachers are doing fabulous work to build those reading skills.  Even if the Times has to correct its publications and even if Heritage never bothers to check its facts, our educators are engaging Common Core fully and thoughtfully, and our students are already gaining ground as a result.

School Districts of Innovation

David Cook Talks About Kentucky's implementation of Districts of Innovation

http://blogs.edweek.org/edweek/engagement_and_reform/2012/12/districts_of_innovation.html

Tuesday, December 11, 2012

Delivery targets: impact on overall scores

Meeting 2013 delivery targets will produce impressive growth in the "overall scores" that combines all of a school's data in a single accountability number on a 0-100 scale.

For example, meeting delivery targets will result in:

  • 3.3 points improvement in the statewide elementary overall score.
  • 4.0 points improvement in the statewide middle school score.
  • 3.3 points improvement in the statewide high school score.

Improvement will be quicker for schools with results below the statewide level, and slower for those above. That's because delivery targets expect more improvement from those who have more to improve.

Because delivery targets are so ambitious, they can also have a big impact on schools' AMOs (short for annual measurable objectives).  AMOs are another part of our new approach to accountability, and they work by taking schools' overall score and asking for increases of:
  • 1.0 points from schools in the bottom 70% for their level.
  •  0.5 points for schools in the top 30% for their level.
Schools that make their delivery targets will exceed their AMOs with plenty of margin to spare!

Better yet, meeting delivery targets will allow schools to move rapidly toward overall scores of 100.
That's sweet news, because 100 is the overall score that will mean all Kentucky students are on track to graduate ready for college and career after consistently making expected growth.

Note to arithmetic lovers: my basic method here is to work out how much each subject's 2012 percent proficient will improve to hit that subject's 2013 delivery target; then multiply by 20% to show how that will change the achievement part of the overall overall score; and then work out how much that will change the overall score by multiplying by 30%, 28%, or 20% for elementary, middle or high schools.  I repeated the same approach for the gap group.  For middle school, I added in a readiness target weighted at 16%, and for high school I added in readiness and graduation each weighted at 20%. E-mail me if you want to see the whole set of calculations.

Monday, December 10, 2012

Delivery targets narrow the gaps

As part of Kentucky's new accountability system, delivery targets ask each school to move halfway from current results to 100 within five years. Each school has targets for a set of indicators, including proficiency in each K-Prep subject for each student group, readiness of middle and high school students, and graduation rates.

The formula has a built-in way of tackling achievement gaps: the further a group is from 100, the more it has to improve to meet that half-way, five-year target.

For example, at the elementary level, 2012 mathematics result show 40.4 percent proficient or above for all students and 19.9 percent for students with disabilities.  That's an aching gap of 20.5 points!

Delivery targets don't ask for that gap to disappear by 2017, but they do call for it to be much smaller, aiming for 70.2 percent of all elementary students and 60.0 percent of students with disabilities to be proficient or above.  That will leave a gap of 10.2 points, still bad but an important step better than our current situation.

Below, I've graphed are the full subject-by-subject, year-by-year targets for elementary students with disabilities.  You can see the weakest subjects will need the quickest improvement, and if you compare to yesterday's graph of all students, you can also see how this approach means that schools will need to provide quicker improvement for this group than for all students in each subject.


Sunday, December 9, 2012

Delivery targets: halfway to 100 in five years


Here’s an excellent part of Kentucky’s new accountability system: delivery targets ask schools to move a set of indicators halfway to 100 in five years, which means a big step up every year.

For example, here’s what that will require statewide  for elementary students in each tested subject:


All schools and districts have delivery targets like these based on their own starting points. There are also matching targets for:
  • The gap group that combines the student groups that have been historically underserved.
  • Each of those student groups separately.
  • For all students, gap group, and subgroups showing reading and mathematics combined. 
  • Middle and high school readiness results.
  • High school graduation rates.

 Want to see the delivery targets for a particular school or district? 

You can find almost all of them in the state’s excellent new on-line School Report Card portal by looking under delivery targets.  One exception is that graduation targets are under accountability, rather than delivery, in the report cards for each school and district.  Another exception is the gap group targets for individual subjects: at least so far, I haven’t found them in the individual report cards, but I did find them in the data sets section of the portal, in the delivery column’s gap file.  One more: I haven't found a middle school readiness delivery target listing yet at all, but the arithmetic makes that one easy to calculate, and high school targets are in the report cards and the data files.

Saturday, December 8, 2012

Top 20 in deeper detail

In 2008, the Prichard Committee challenged Kentucky to set its sites on having schools in the top twenty of the fifty states on a set of important indicators, and shared Kentucky's standings at that point.  This week, the 2012 report on state progress toward those goals is out, and as Stu Silberman has noted, it "offers reason for a real sense of pride and also a real sense of urgency.”

ON TRACK FOR 2020 
New results show Kentucky moving up on ten of the twenty categories, either reaching the Top 20 or improving at a rate to get there by 2020. Kentucky ranks:
  • 4th in fourth-grade science 
  • 11th in fourth-grade reading 
  • 13th in eighth-grade reading 
  • 16th in completion of associate’s degrees 
  • 17th in eighth-grade science 
  • 21st in family share of higher education costs 
  • 25th in fourth-grade math 
  • 28th in average teacher salary 
  • 30th in adults with a high school diploma or equivalent 
  • 31st in high school graduates going on to college 

IMPROVING, BUT SLOWLY 
On five categories, new results show gains, but the state is moving too slowly to reach the Top 20 on time. Kentucky ranks:
  • 29th in students earning AP college credit 
  • 32nd in eighth-grade math 
  • 35th in bachelor’s degree completion 
  • 38th in bachelor’s degree attainment 
  • 43rd in share of bachelor’s degrees earned in science, technology, engineering and math 

FLAT OR LOSING GROUND 
New results show Kentucky stuck or losing ground on three categories. Kentucky ranks:
  • 21st in per-pupil higher education funding 
  • 29th in preschool enrollment 
  • 41st in per-pupil K-12 funding 

NO NEWS
Two categories had no new data since the 2012 report. In those areas, Kentucky still ranks:
  • 20th in fourth-grade writing, based on 2002 data 
  • 36th in eighth-grade writing, based on 2007 data
Do check out the complete report, with trend graphs from 2008 forward and Prichard recommendations for reaching the Top 20 goals over the coming eight years.  It's an important way of understanding Kentucky's past progress and making sure we move even more strongly forward in the coming years.

Focus schools in mathematics (a follow-up)

Kentucky now identifies schools as "focus schools" for added support if any student subgroup scores below the third standard deviation in any subject.  In an earlier post, I showed the number of schools identified for this status based on 2012 results, using this graph:
At this week's Kentucky Board of Education meeting, Ken Draut answered one of the puzzles raised by that graph: why no mathematics identifications?

In a nutshell, it's an effect of low, low scores.  If you have a mean of 32 percent proficient and a standard deviation of 12,  you end up looking for  minus-4 percent proficiency--and that's basically how the math scores shook out.

Ken Draut suggested to KBE that the regulation can be amended to say that we'll use zero percent proficient if the third standard deviation yields a negative number.  An amendment makes sense, and that one would solve the problem.

I'm going to throw out an alternative: define a focus school based on gap group to be" an individual student subgroup .... with a score  that places that subgroup in the bottom 1 percent  for all students."  That' can be easier for most folks  to understand, and in most cases it will yield the same result as the third standard deviation method--but when the deviation goes negative, the 1 percent method will still allow schools to be identified if a gap group is far enough below the state mean.

Friday, December 7, 2012

Friday, November 23, 2012

A fresh focus on grim gaps

Under our new "Unbridled Learning" approach to accountability, if a school's results show a particular student subgroup to score at rock bottom, the state steps in to ensure new, more intensive planning to raise those results. 

That is, the Kentucky Department of Education identifies "focus schools" where any subgroup's results in any subject falls in the bottom 1 percent for all students.  (Formally, the rules say the scores are in the "third standard deviation," but bottom 1 percent is easier to remember and understand.)  

The chart above summarizes this year's identifications of 372 groups scoring at that very low level, spread over 244 schools, with plenty to puzzle over:
  • Reading: why are more than half of these severe gaps clustered in one subject?
  • Mathematics: how did one discipline avoid any gaps of this sort at all?
  • Students with disabilities: what are the effective responses when one student group has three-quarters of the deepest gaps?
  • Low-income: what should we think about the fact that only 2% of the identified gaps involve this group we know to be disadvantaged?
While we're puzzling, let's notice that it's the right puzzle. This analysis uses a consistent standard (bottom 1%) for all subjects and all groups, allowing us to do this kind of comparison of where the gaps occur.  That's a nice step forward in thinking about a problem that isn't nice at all.

Sunday, November 18, 2012

Teacher careers and principals' impact

The Atlantic Monthly shares a new study on why so many teachers leave the profession:
The researchers found that the most important factor influencing commitment was the beginning teacher's perception of how well the school principal worked with the teaching staff as a whole. This was a stronger factor than the adequacy of resources, the extent of a teacher's administrative duties, the manageability of his or her workload, or the frequency of professional-development opportunities.
This finding matches wider business research on employee retention as well as an earlier Massachusetts study of teachers.  That part, and the other study findings strike me as very plausible.

When the article turns to solutions, I'm less impressed.  Peter Youngs, one of the researchers, is quoted as proposing that principals should spend more time studying interpersonal skills in university courses and professional development sessions.  Respectfully, I'd like to suggest that if the most important factor in whether teachers are willing to stay in their jobs is the principal, the most important factor in whether principals can do their jobs well enough for teachers to stay is sure to be superintendents.

Monday, November 5, 2012

A proficient elementary school example (WITH CORRECTION]

NOTE: THE FINAL GRAPH IN THIS POST HAS BEEN REPLACED TO SHOW CORRECT DATA.  I APOLOGIZE FOR THAT ERROR.

Stu Silberman suggested that I share elementary example to match yesterday's high school post.

Under Kentucky's new accountability system, schools are identified as proficient if their Overall Score is at or above the 70th percentile for schools at their level.  Now that first year results have been released, it's easier to illustrate what goes into the Overall Scores and the proficient classification

To begin, each school now receives an Overall Score on a 0-100 scale.  For elementary schools, 100 will mean that all students are on track to being college and career ready and they are all making typical or higher growth.  Here's the actual example, showing the school's Overall Score of 62.5 and the three components that go into it:


The 73.1 for Achievement shown above is calculated from the students' performance levels in five subjects:

The 46.5 for Gap is also calculated from those five-subjects performance levels, using data only for students in groups that have historically been underserved:

Finally, the 66.6 for Growth reflects the students making typical growth in the two subjects tested more than once in high school:


In future years, the plan is to add program review results and professional growth and evaluation data to the Overall Score calculation. As that happens, the 70th percentile cut point will be adjusted. Once the full formula is in place, the state regulation calls for the 70th percentile to be recalculated every five years.

Added note: I've treated the school above simply as an example to help illustrate the main elements involved in being classified as a proficient school, using one of the four elementary schools with an Overall Score of 62.5.  Though my purpose is to clarify the process rather than focus on a particular school, I'll satisfy any reader curiosity and mention that charts above show data from Madison County's Waco Elementary.

Sunday, November 4, 2012

A proficient high school example

Under Kentucky's new accountability system, schools are identified as proficient if their Overall Score is at or above the 70th percentile for schools at their level.  Now that first year results have been released, it's easier to illustrate what goes into the Overall Scores and the proficient classification  I'll use a high school right at that 70th percentile cut off to do just that.

To begin, each school now receives an Overall Score on a 0-100 scale.  For high schools, 100 will mean that all students are college and career ready, making typical or higher growth, and graduating on time.  Here's the actual example, showing the school's Overall Score of 58.0 and the five components that go into it.
The 64.5 for Achievement shown above is calculated from the students' performance levels in five subjects:
The 41.7 for Gap is also calculated from those five-subjects performance levels, using data only for students in groups that have historically been underserved:
The 59.5 for Growth reflects the students making typical growth in the two subjects tested more than once in high school. The 47.1 for Readiness looks at ACT and other tests of readiness for college, career or both, with half- point bonuses for students being ready for both options.  Here are the details on those two results:
Finally, the 77.3 for Graduation is simply the school's 77.3 percent averaged freshman graduation rate shown above.

In future years, the plan is to add program review results and professional growth and evaluation data to the Overall Score calculation. As that happens, the 70th percentile cut point will be adjusted. Once the full formula is in place, the state regulation calls for the 70th percentile to be recalculated every five years.

Added note: I've treated the school above simply as an example to help illustrate the main elements involved in being classified as a proficient school, using one of the three high schools with an Overall Score of 58.0.  Though my purpose is to clarify the process rather than focus on a particular school, I'll satisfy any reader curiosity and mention that charts above show data from Bracken County High.

Friday, November 2, 2012

Disaggregated results (because it's about every child)

Take what we already knew about achievement gaps between student groups.  Combine it with our growing understanding that all students need to move up to a substantially higher definition of proficiency.  The results are painful to see--and this post invites you to see that pain. The results below are high school results only.

Please let them make you sad.  Especially, let yourself ache a bit about the results for students with disabilities and students with limited English proficiency, and the continuing legacy of unequal education for students of color.

Then, let them make you strong, because we have plenty of work ahead!

(All the results are taken from the online statewide School Report Card.)


The work begins anew


Kentucky has moved more quickly than any state in the country to define and assess student results that meet the demands of a knowledge-driven future.  This morning, in our newly released School Report Card, we meet the first data, and we see with new clarity what we will need to do to move all our children to those higher expectations.

The chart above shows where we stand in most succinct form, using the overall scores from  our new accountability system.  In that system, a score of 100 meaning that all students (including those in historically underserved groups) are on track to graduate from high school ready for college and career.  By that measure, we're a little more than half way there.

The elementary score combines three kinds of student results shown below.  The achievement number reflects results for all students in reading, mathematics, science, social studies, writing, and language mechanics.  The gap score indicates similar data for students in groups that are often "caught in the achievement gap," while the growth score based on the percent of students making expected growth from one year to the next in reading and mathematics.
The middle school score uses those three kinds of data and adds a college and career readiness indicator based on the Explore test taken by eighth graders.  Here's how those results break out this year.
The high school score reflects college and career readiness measured by ACT and other assessments, and adds in graduation data. Here's how those stack up.

The bottom line is that, this  morning, we can clearly define the work ahead of us. Kentucky has committed itself to raise all of these results to the high levels our children will need for full success in the economy and in their communities.  As you can see, that will be a mighty undertaking, and all of us--parents, teachers, citizens, elected leaders--will have major roles to play.

These results and further details--for our state, districts, and individual schools--is now easily accessible at the Department of Education's Open House.