Thursday, January 10, 2013
Friday, January 4, 2013
New Year's Advocacy Resolutions
It's 2013 - What issues should we advocate for to ensure that our kids get a great education?
http://blogs.edweek.org/edweek/engagement_and_reform/2013/01/new_years_advocacy_resolutions.html
http://blogs.edweek.org/edweek/engagement_and_reform/2013/01/new_years_advocacy_resolutions.html
Thursday, January 3, 2013
Where poverty hits hardest (KidsCount data!)
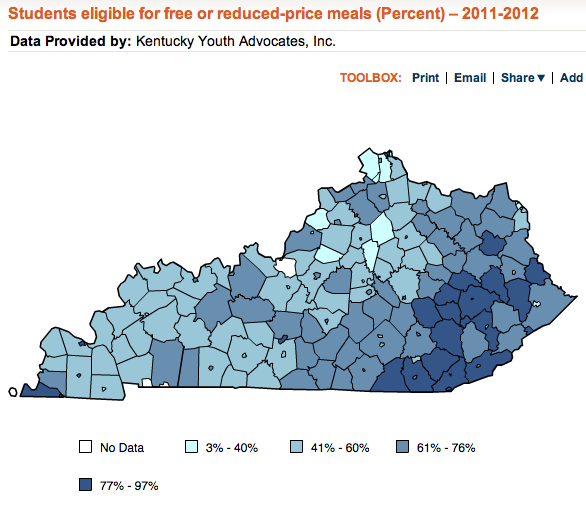
The map above comes from the newly-released 2012 KidsCount reporting on individual school districts, counties, and congressional districts. In it, you can see a fresh illustration of how many students across the state are growing up in homes with low incomes.
You can also see an illustration of how those difficulties cluster across the state. The eastern counties grab the eye, and don't miss Fulton at the opposite end of the state. Since they're harder to see, I'll also note that there are a set of independent districts also in the dark, difficult blue:
- Covington, Dayton, Newport, and Silver Grove in the north.
- Middlesboro and Jenkins in the east.
- Caverna in the central west.
- Fulton Independent, Mayfield, and Paducah in the far west.
I love the way the Kids Count maps include the range, letting you know that the state ranges from 3% to 97% participation in the free and reduced-price meal program. To illustrate where that range occurs, I'll include tables below listing the highest 10 and lowest 10 participation rates. I do hope you'll play with the KidsCount information for yourself, and I'm working on several more posts on what I'm seeing as I explore.


Tuesday, December 18, 2012
Common Core: Lessons Learned in Kentucky
A guest post from Ketucky's Commissioner's of Education on Lessons Learned From Implementing the Common Core
http://blogs.edweek.org/edweek/engagement_and_reform/2012/12/lesson_learned_in_kentucky.html
http://blogs.edweek.org/edweek/engagement_and_reform/2012/12/lesson_learned_in_kentucky.html
Wednesday, December 12, 2012
Common Core Reading: A Full Range of Texts
I've now seen multiple authors claim that the Common Core State Standards mandate that reading and English classes can only have 50% of their texts be literature, with the other 50% a variety of non-literary readings. For example, there's this new Heritage Foundation publication, and last month there was this (now corrected) New York Times piece.
That claim is untrue, and this post offers a review just how and why it is false.
Lets start with the one place that Common Core uses the number 50%: it's in this table on page 5 of the official standards document:

The document then explains that the Standards "aim to align instruction with" the NAEP reading framework, which does mean 50% literary reading in grade 4 and then smaller shares in grade 8 and grade 12.
The thing is, that does not mean 50% of an elementary school's reading hour or 30-45% of the one period a day the upper grades devote to language arts and English. Common Core stakes a claim to the full instructional day and homework time beyond that.
Here's the key Common Core statement that appears right below that table:
In K–5, the Standards follow NAEP’s lead in balancing the reading of literature with the reading of informational texts, including texts in history/ social studies, science, and technical subjects. In accord with NAEP’s growing emphasis on informational texts in the higher grades, the Standards demand that a significant amount of reading of informational texts take place in and outside the ELA classroom. Fulfilling the Standards for 6–12 ELA requires much greater attention to a specific category of informational text—literary nonfiction—than has been traditional. Because the ELA classroom must focus on literature (stories, drama, and poetry) as well as literary nonfiction, a great deal of informational reading in grades 6–12 must take place in other classes if the NAEP assessment framework is to be matched instructionally. [emphasis added]
Why does Common Core call for literature and more, studied in English classrooms and many others?
It's because today's students will read widely as tomorrow's adults:
- In their careers and postsecondary education, they'll need to read everything from scientific research and economic analysis to manuals for advanced machinery and guidance on implementing complex legal requirements.
- As citizens and community participants, they'll need to read analysis of current events, speeches, editorials, historical explanations, and on and on.
- As members and builders of our shared culture, naturally they'll also need to engage literature and richly literary nonfiction.
For our next generation, reading will be a mix of all those kinds of texts, so Common Core calls on our schools to equip them for that full range of expectations.
In fact, the document's proper name is "Common Core State Standards for English Language Arts & Literacy in History/Social Studies, Science, and Technical Subjects." The proof that Common Core aims for high levels of fluency with literature and other reading texts, learned in English and other classrooms, is right there on the cover.
One more thing: Kentucky science, history, and other teachers are doing fabulous work to build those reading skills. Even if the Times has to correct its publications and even if Heritage never bothers to check its facts, our educators are engaging Common Core fully and thoughtfully, and our students are already gaining ground as a result.
School Districts of Innovation
David Cook Talks About Kentucky's implementation of Districts of Innovation
http://blogs.edweek.org/edweek/engagement_and_reform/2012/12/districts_of_innovation.html
http://blogs.edweek.org/edweek/engagement_and_reform/2012/12/districts_of_innovation.html
Tuesday, December 11, 2012
Delivery targets: impact on overall scores
Meeting 2013 delivery targets will produce impressive growth in the "overall scores" that combines all of a school's data in a single accountability number on a 0-100 scale.
For example, meeting delivery targets will result in:
Improvement will be quicker for schools with results below the statewide level, and slower for those above. That's because delivery targets expect more improvement from those who have more to improve.
Because delivery targets are so ambitious, they can also have a big impact on schools' AMOs (short for annual measurable objectives). AMOs are another part of our new approach to accountability, and they work by taking schools' overall score and asking for increases of:
For example, meeting delivery targets will result in:
- 3.3 points improvement in the statewide elementary overall score.
- 4.0 points improvement in the statewide middle school score.
- 3.3 points improvement in the statewide high school score.
Improvement will be quicker for schools with results below the statewide level, and slower for those above. That's because delivery targets expect more improvement from those who have more to improve.
Because delivery targets are so ambitious, they can also have a big impact on schools' AMOs (short for annual measurable objectives). AMOs are another part of our new approach to accountability, and they work by taking schools' overall score and asking for increases of:
- 1.0 points from schools in the bottom 70% for their level.
- 0.5 points for schools in the top 30% for their level.
Schools that make their delivery targets will exceed their AMOs with plenty of margin to spare!
Better yet, meeting delivery targets will allow schools to move rapidly toward overall scores of 100.
That's sweet news, because 100 is the overall score that will mean all Kentucky students are on track to graduate ready for college and career after consistently making expected growth.
Better yet, meeting delivery targets will allow schools to move rapidly toward overall scores of 100.
That's sweet news, because 100 is the overall score that will mean all Kentucky students are on track to graduate ready for college and career after consistently making expected growth.
Note to arithmetic lovers: my basic method here is to work out how much each subject's 2012 percent proficient will improve to hit that subject's 2013 delivery target; then multiply by 20% to show how that will change the achievement part of the overall overall score; and then work out how much that will change the overall score by multiplying by 30%, 28%, or 20% for elementary, middle or high schools. I repeated the same approach for the gap group. For middle school, I added in a readiness target weighted at 16%, and for high school I added in readiness and graduation each weighted at 20%. E-mail me if you want to see the whole set of calculations.
Monday, December 10, 2012
Delivery targets narrow the gaps
As part of Kentucky's new accountability system, delivery targets ask each school to move halfway from current results to 100 within five years. Each school has targets for a set of indicators, including proficiency in each K-Prep subject for each student group, readiness of middle and high school students, and graduation rates.
The formula has a built-in way of tackling achievement gaps: the further a group is from 100, the more it has to improve to meet that half-way, five-year target.
For example, at the elementary level, 2012 mathematics result show 40.4 percent proficient or above for all students and 19.9 percent for students with disabilities. That's an aching gap of 20.5 points!
Delivery targets don't ask for that gap to disappear by 2017, but they do call for it to be much smaller, aiming for 70.2 percent of all elementary students and 60.0 percent of students with disabilities to be proficient or above. That will leave a gap of 10.2 points, still bad but an important step better than our current situation.
Below, I've graphed are the full subject-by-subject, year-by-year targets for elementary students with disabilities. You can see the weakest subjects will need the quickest improvement, and if you compare to yesterday's graph of all students, you can also see how this approach means that schools will need to provide quicker improvement for this group than for all students in each subject.

Sunday, December 9, 2012
Delivery targets: halfway to 100 in five years
Here’s an excellent part of Kentucky’s new accountability system:
delivery targets ask schools to move a set of indicators halfway to 100 in five
years, which means a big step up every year.
For example, here’s what that will require statewide for elementary
students in each tested subject:

All schools and districts have delivery targets like these based
on their own starting points. There are also matching targets for:
- The gap group that combines the student groups that have been historically underserved.
- Each of those student groups separately.
- For all students, gap group, and subgroups showing reading and mathematics combined.
- Middle and high school readiness results.
- High school graduation rates.
You can find almost all of them in the state’s excellent new on-line
School Report Card portal by looking under delivery targets. One exception is that graduation targets are
under accountability, rather than delivery, in the report cards for each school and district.
Another exception is the gap group targets for individual subjects: at
least so far, I haven’t found them in the individual report cards, but I
did find them in the data sets section of the portal, in the delivery column’s
gap file. One more: I haven't found a middle school readiness delivery target listing yet at all, but the arithmetic makes that one easy to calculate, and high school targets are in the report cards and the data files.
Saturday, December 8, 2012
Top 20 in deeper detail
In 2008, the Prichard Committee challenged Kentucky to set its sites on having schools in the top twenty of the fifty states on a set of important indicators, and shared Kentucky's standings at that point. This week, the 2012 report on state progress toward those goals is out, and as Stu Silberman has noted, it "offers reason for a real sense of pride and also a real sense of urgency.”
ON TRACK FOR 2020
New results show Kentucky moving up on ten of the twenty categories, either reaching the Top 20 or improving at a rate to get there by 2020. Kentucky ranks:
IMPROVING, BUT SLOWLY
On five categories, new results show gains, but the state is moving too slowly to reach the Top 20 on time. Kentucky ranks:
FLAT OR LOSING GROUND
New results show Kentucky stuck or losing ground on three categories. Kentucky ranks:
NO NEWS
Two categories had no new data since the 2012 report. In those areas, Kentucky still ranks:
ON TRACK FOR 2020
New results show Kentucky moving up on ten of the twenty categories, either reaching the Top 20 or improving at a rate to get there by 2020. Kentucky ranks:
- 4th in fourth-grade science
- 11th in fourth-grade reading
- 13th in eighth-grade reading
- 16th in completion of associate’s degrees
- 17th in eighth-grade science
- 21st in family share of higher education costs
- 25th in fourth-grade math
- 28th in average teacher salary
- 30th in adults with a high school diploma or equivalent
- 31st in high school graduates going on to college
IMPROVING, BUT SLOWLY
On five categories, new results show gains, but the state is moving too slowly to reach the Top 20 on time. Kentucky ranks:
- 29th in students earning AP college credit
- 32nd in eighth-grade math
- 35th in bachelor’s degree completion
- 38th in bachelor’s degree attainment
- 43rd in share of bachelor’s degrees earned in science, technology, engineering and math
FLAT OR LOSING GROUND
New results show Kentucky stuck or losing ground on three categories. Kentucky ranks:
- 21st in per-pupil higher education funding
- 29th in preschool enrollment
- 41st in per-pupil K-12 funding
NO NEWS
Two categories had no new data since the 2012 report. In those areas, Kentucky still ranks:
- 20th in fourth-grade writing, based on 2002 data
- 36th in eighth-grade writing, based on 2007 data
Do check out the complete report, with trend graphs from 2008 forward and Prichard recommendations for reaching the Top 20 goals over the coming eight years. It's an important way of understanding Kentucky's past progress and making sure we move even more strongly forward in the coming years.
Focus schools in mathematics (a follow-up)
Kentucky now identifies schools as "focus schools" for added support if any student subgroup scores below the third standard deviation in any subject. In an earlier post, I showed the number of schools identified for this status based on 2012 results, using this graph:
 At this week's Kentucky Board of Education meeting, Ken Draut answered one of the puzzles raised by that graph: why no mathematics identifications?
In a nutshell, it's an effect of low, low scores. If you have a mean of 32 percent proficient and a standard deviation of 12, you end up looking for minus-4 percent proficiency--and that's basically how the math scores shook out.
Ken Draut suggested to KBE that the regulation can be amended to say that we'll use zero percent proficient if the third standard deviation yields a negative number. An amendment makes sense, and that one would solve the problem.
I'm going to throw out an alternative: define a focus school based on gap group to be" an individual student subgroup .... with a score that places that subgroup in the bottom 1 percent for all students." That' can be easier for most folks to understand, and in most cases it will yield the same result as the third standard deviation method--but when the deviation goes negative, the 1 percent method will still allow schools to be identified if a gap group is far enough below the state mean.
Friday, December 7, 2012
How is Kentucky Progressing Nationally?
Top 20 by 2020 Report Shows Student Achievement Stronger While Support Lags
http://www.prichardcommittee.org/wp-content/uploads/2012/12/Top-20-Report-2012.pdf
..........more to come
http://www.prichardcommittee.org/wp-content/uploads/2012/12/Top-20-Report-2012.pdf
..........more to come
Wednesday, December 5, 2012
How Are Kentuckians Handling Lower Test Scores?
What has been the reaction thus far to lower scores?
http://blogs.edweek.org/edweek/engagement_and_reform/2012/12/how_is_kentucky_handling_lower_test_scores.html
http://blogs.edweek.org/edweek/engagement_and_reform/2012/12/how_is_kentucky_handling_lower_test_scores.html
Wednesday, November 28, 2012
Tuesday, November 27, 2012
Could This Be Everything You Wanted to Know About Tracking But Were Afraid to Ask?
Information on Ability Grouping - Is it good or bad?
http://blogs.edweek.org/edweek/engagement_and_reform/2012/11/_i_recently_received_the.html
http://blogs.edweek.org/edweek/engagement_and_reform/2012/11/_i_recently_received_the.html
Friday, November 23, 2012
A fresh focus on grim gaps
Under our new "Unbridled Learning" approach to accountability, if a school's results show a particular student subgroup to score at rock bottom, the state steps in to ensure new, more intensive planning to raise those results.
That is, the Kentucky Department of Education identifies "focus schools" where any subgroup's results in any subject falls in the bottom 1 percent for all students. (Formally, the rules say the scores are in the "third standard deviation," but bottom 1 percent is easier to remember and understand.)
The chart above summarizes this year's identifications of 372 groups scoring at that very low level, spread over 244 schools, with plenty to puzzle over:
- Reading: why are more than half of these severe gaps clustered in one subject?
- Mathematics: how did one discipline avoid any gaps of this sort at all?
- Students with disabilities: what are the effective responses when one student group has three-quarters of the deepest gaps?
- Low-income: what should we think about the fact that only 2% of the identified gaps involve this group we know to be disadvantaged?
While we're puzzling, let's notice that it's the right puzzle. This analysis uses a consistent standard (bottom 1%) for all subjects and all groups, allowing us to do this kind of comparison of where the gaps occur. That's a nice step forward in thinking about a problem that isn't nice at all.
Sunday, November 18, 2012
Teacher careers and principals' impact
The Atlantic Monthly shares a new study on why so many teachers leave the profession:
When the article turns to solutions, I'm less impressed. Peter Youngs, one of the researchers, is quoted as proposing that principals should spend more time studying interpersonal skills in university courses and professional development sessions. Respectfully, I'd like to suggest that if the most important factor in whether teachers are willing to stay in their jobs is the principal, the most important factor in whether principals can do their jobs well enough for teachers to stay is sure to be superintendents.
The researchers found that the most important factor influencing commitment was the beginning teacher's perception of how well the school principal worked with the teaching staff as a whole. This was a stronger factor than the adequacy of resources, the extent of a teacher's administrative duties, the manageability of his or her workload, or the frequency of professional-development opportunities.This finding matches wider business research on employee retention as well as an earlier Massachusetts study of teachers. That part, and the other study findings strike me as very plausible.
When the article turns to solutions, I'm less impressed. Peter Youngs, one of the researchers, is quoted as proposing that principals should spend more time studying interpersonal skills in university courses and professional development sessions. Respectfully, I'd like to suggest that if the most important factor in whether teachers are willing to stay in their jobs is the principal, the most important factor in whether principals can do their jobs well enough for teachers to stay is sure to be superintendents.
Thursday, November 15, 2012
Support the Common Core Standards
Resources to Help Advocate for the Common Core Standards
http://blogs.edweek.org/edweek/engagement_and_reform/2012/11/support_the_common_core_some_resources_to_get_started.html
http://blogs.edweek.org/edweek/engagement_and_reform/2012/11/support_the_common_core_some_resources_to_get_started.html
Tuesday, November 6, 2012
More on Turning Schools Around
Schools need help to turn around:
http://blogs.edweek.org/edweek/engagement_and_reform/2012/11/more_on_turning_schools_around.html
http://blogs.edweek.org/edweek/engagement_and_reform/2012/11/more_on_turning_schools_around.html
Monday, November 5, 2012
A proficient elementary school example (WITH CORRECTION]
NOTE: THE FINAL GRAPH IN THIS POST HAS BEEN REPLACED TO SHOW CORRECT DATA. I APOLOGIZE FOR THAT ERROR.
Stu Silberman suggested that I share elementary example to match yesterday's high school post.
Under Kentucky's new accountability system, schools are identified as proficient if their Overall Score is at or above the 70th percentile for schools at their level. Now that first year results have been released, it's easier to illustrate what goes into the Overall Scores and the proficient classification
To begin, each school now receives an Overall Score on a 0-100 scale. For elementary schools, 100 will mean that all students are on track to being college and career ready and they are all making typical or higher growth. Here's the actual example, showing the school's Overall Score of 62.5 and the three components that go into it:

The 73.1 for Achievement shown above is calculated from the students' performance levels in five subjects:

The 46.5 for Gap is also calculated from those five-subjects performance levels, using data only for students in groups that have historically been underserved:

Finally, the 66.6 for Growth reflects the students making typical growth in the two subjects tested more than once in high school:

In future years, the plan is to add program review results and professional growth and evaluation data to the Overall Score calculation. As that happens, the 70th percentile cut point will be adjusted. Once the full formula is in place, the state regulation calls for the 70th percentile to be recalculated every five years.
Added note: I've treated the school above simply as an example to help illustrate the main elements involved in being classified as a proficient school, using one of the four elementary schools with an Overall Score of 62.5. Though my purpose is to clarify the process rather than focus on a particular school, I'll satisfy any reader curiosity and mention that charts above show data from Madison County's Waco Elementary.
Subscribe to:
Comments (Atom)