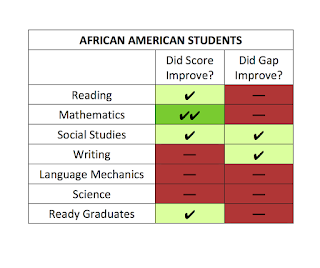
Here are the small tables that summarize changes for Kentucky's African American students, Hispanic students, and students of two or more races. As with
the other tables shared yesterday, a dash across a red background indicates results that did not improve from 2015 to 2016. A check mark on a green background means positive change, and double check marks on darker green show positive change of two or more points.
Of the three charts, the one for African American students is the most positive, but the trends are still pretty mixed. Results improved in three subjects in ready graduation, but also went down in three subjects. The gaps compared to white students only improved in two subjects, and the writing gap change is based on both groups losing grounds but white students taking the larger loss.
Students of two or more races also had mixed results, while Hispanic results were pretty steadily troubling: only math showed score improvement and both of the gaps that narrowed shrank because of white declines that were bigger than those for Hispanic students.
More generally, do note that the positive changes leave plenty of work still to be done
to serve all students well.
All three tables come from the Prichard Committee's new
“2016 Statewide Results: An Excellence with Equity Report.” The press release announcing the report is
available here, and the full report can be
downloaded here.


No comments:
Post a Comment
Updates and data on Kentucky education!